
The cost of electricity
The cost of electricity covers different concepts:
The energy transition will impact both due to the building of significant wind and solar capacity forming the bulk of future electricity generation and the strong increase of CO₂ price impacting remaining fossil thermal generation.
The definition of TYNDP scenarios is based on a system perspective looking at the minimisation of the overall system cost. The evolution of wind, solar and thermal capacity follows an energy only approach.
Marginal prices
Today the marginal price is set by thermal units for most of the hours of the year. Prices range according to a merit order based on the efficiency, fuel cost and carbon price of power generation. Compared to previous edition, a higher CO₂ cost assumption has induced a rise in marginal prices of all scenarios. In some markets, zero or negative marginal prices may appear due to oversupply that cannot be stored or transported to another markets. By offering new and flexible opportunity to use electricity, sector coupling reduces the occurrence of such price situations.
With the expected development of wind and solar, the shape of the marginal price curve across the year is likely to change with more hours at very low prices induced by RES either directly or through storage discharge.
When residual demand (final electricity demand reduced by variable RES production) will remain high, marginal prices are likely to increase compared to nowadays as fuel and CO₂ prices will be higher. As a result, the volatility of marginal electricity price throughout the year may be higher than today.
The development of electrolysis for the production of synthetic fuels (hydrogen, e-gas and e-liquids) will link the price of electricity with those of other sources of molecules. At the same time the increase of marginal prices triggered by electrolysis demand will create an incentive for the development of additional RES capacity.
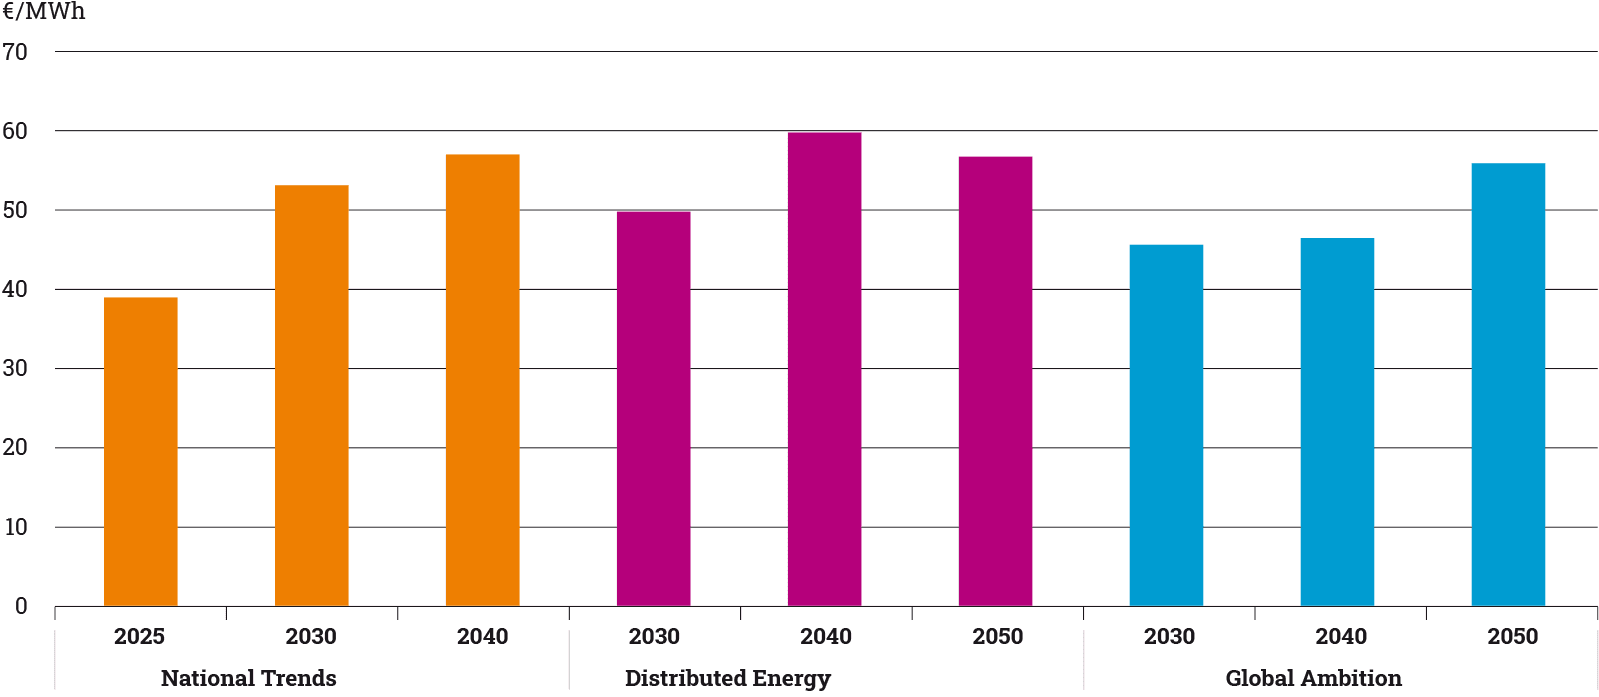
Figure 44: Marginal price in the electricity market (EU27 marginal price is built as the weighted average of hourly marginal price for each hour and bidding zone based using hourly electricity generation as a weight).
Levelised cost of electricity
The concept of LCOE has been used for many years to compare the cost between electricity sources. It enables an easy comparison of unit costs between technologies by combining CAPEX, OPEX and load factor on the economic lifetime of the asset.
In a system where most of the generation is ensured by flexible thermal units, LCOE is a meaningful criterion as the integration of wind and solar does not trigger massive adaptation of the system to accommodate their variability. In fact, such technologies continue to develop despite decreasing incentive schemes as they are becoming mature. In many cases their LCOE are already significantly lower compared to low carbon equivalent (e. g., CCGTs with CCS) and soon with unabated fossil thermal units due to an increasing CO₂ price.
When building scenarios aiming at climate neutrality in 2050, the very high penetration rate reached by wind and solar beyond 2030 changes the operation of the electricity system. Flexibility and other services offered today by thermal units will have to be provided by other technologies in order to ensure a reliable operation of the system every hour of the year. As a result, LCOE becomes a less relevant criteria to compare renewable and other investment options of very different nature as generation, flexibility and grid.
For this reason, the investment model used to build Distributed Energy and Global Ambition scenarios relies on all CAPEX and OPEX of investment candidates together with fuel and CO₂ prices for a reliable electricity system. It ensures that the CAPEX and fixed costs of a technology are recovered over the economic/technical lifetime of the investment also taking into account the value of lost load. The Scenario Building Guidelines provide an overview of the investment CAPEX and fixed cost assumptions for each of the technologies considered by the scenario building process.
The investment model selects the investment candidates ensuring the minimisation of the overall system cost for the whole geographic perimeter. It also prevents overinvestment in a particular technology, such as solar PV, as their similar generation profiles reduce the marginal price on sunny hours, so that further investment is not economically viable. Flexibility options such as batteries and interconnection benefit from higher marginal price by delivering later (through storage) or in another bidding zone (through interconnection).
Figure 45: Solar PV load factor for the Climatic year 2009 – Distributed Energy 2040
Figure 46: Onshore wind load factor for the Climatic year 2009 – Distributed Energy 2040
Figure 47: Offshore wind load factor for the Climatic year 2009 – Distributed Energy 2040
While LCOE may no longer fit the purpose of comparing investment candidates within a wide range of technologies, it is still useful to compare the location for a given technology as it takes into account resource availability both in a geographical and climatic sense.
The cost of technology for residential PV is stable across Europe however its load factor is wholly dependent on the geographical location. For example, solar PV average load factor is 18 % in Spain and only 10 % in Finland. Based on cost assumption for Distributed Energy in 2050, it results in a LCOE of ~14 €/MWh in Spain compared to ~26 €/MWh in Finland.
With competitive RES, the decision on building new conventional thermal plants will be increasingly driven by the flexibility need of the electricity system rather than delivering energy across the year. Their role will be to meet the residual demand and ensure national and regional security of supply through interconnections. The choice between cheaper units (e. g., OCGT) and more sophisticated, expensive and efficient units (e. g. CCGT) will depend on the number of running hours required to balance the system and the price of low carbon equivalents to present fossil fuels. These technologies will also need to compete against other forms of flexibility, such as interconnectors, demand side response, batteries and hydrogen storage.
Nuclear is a specific technology as the choice to build new units not only depends on the economics of the facility but also on political and industrial decision considering the overall value chain. As a result, the development of new capacity is an input to the scenarios with no new units in Distributed Energy while Global Ambition follows a trend set by high trajectories from the relevant TSOs of countries anticipating new nuclear. Therefore, nuclear generation is only influencing the marginal prices of the scenarios.
As a result, the comparison of economic competitiveness of new power generation units could be clustered in two groups:
- Wind and solar as the main electricity source in terms of energy delivered on annual basis;
- Thermal generation as a source of flexibility on the generation side (in competition with other flexibility options such as batteries, DSM or interconnections).
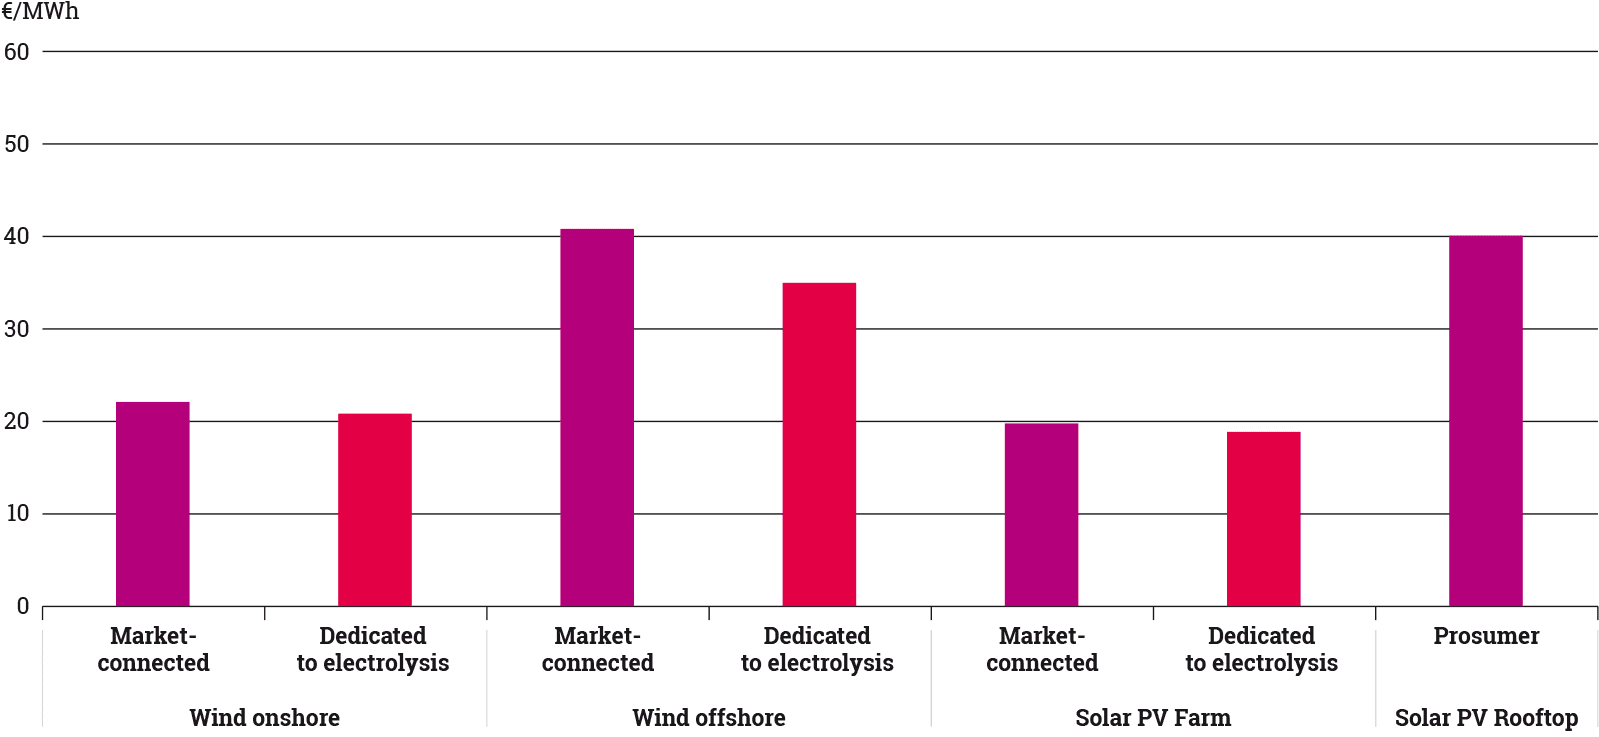
Figure 48: LCOE of wind and solar under different configurations – Distributed Energy 2040
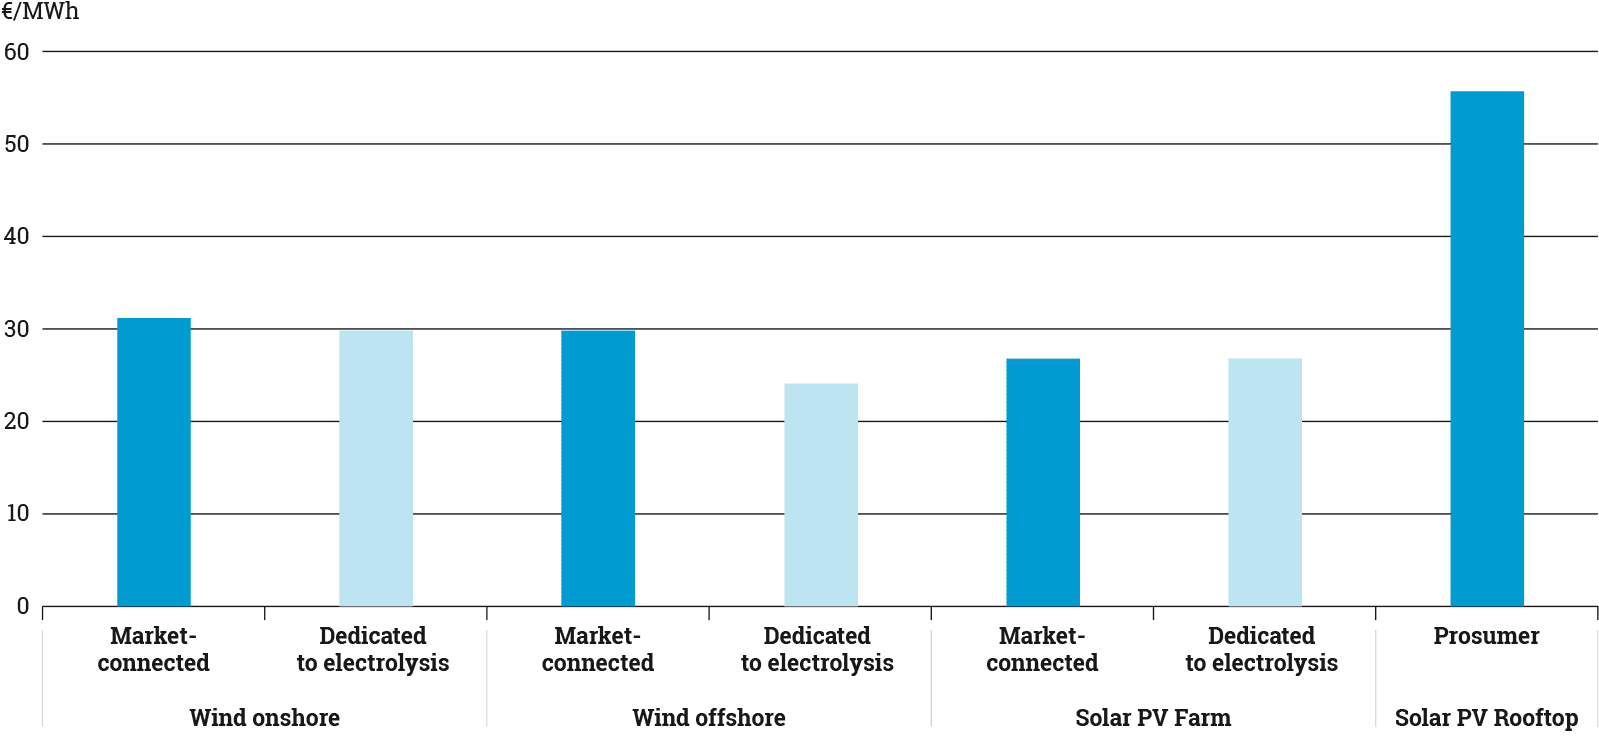
Figure 49: LCOE of wind and solar in different configurations – Global Ambition 2040
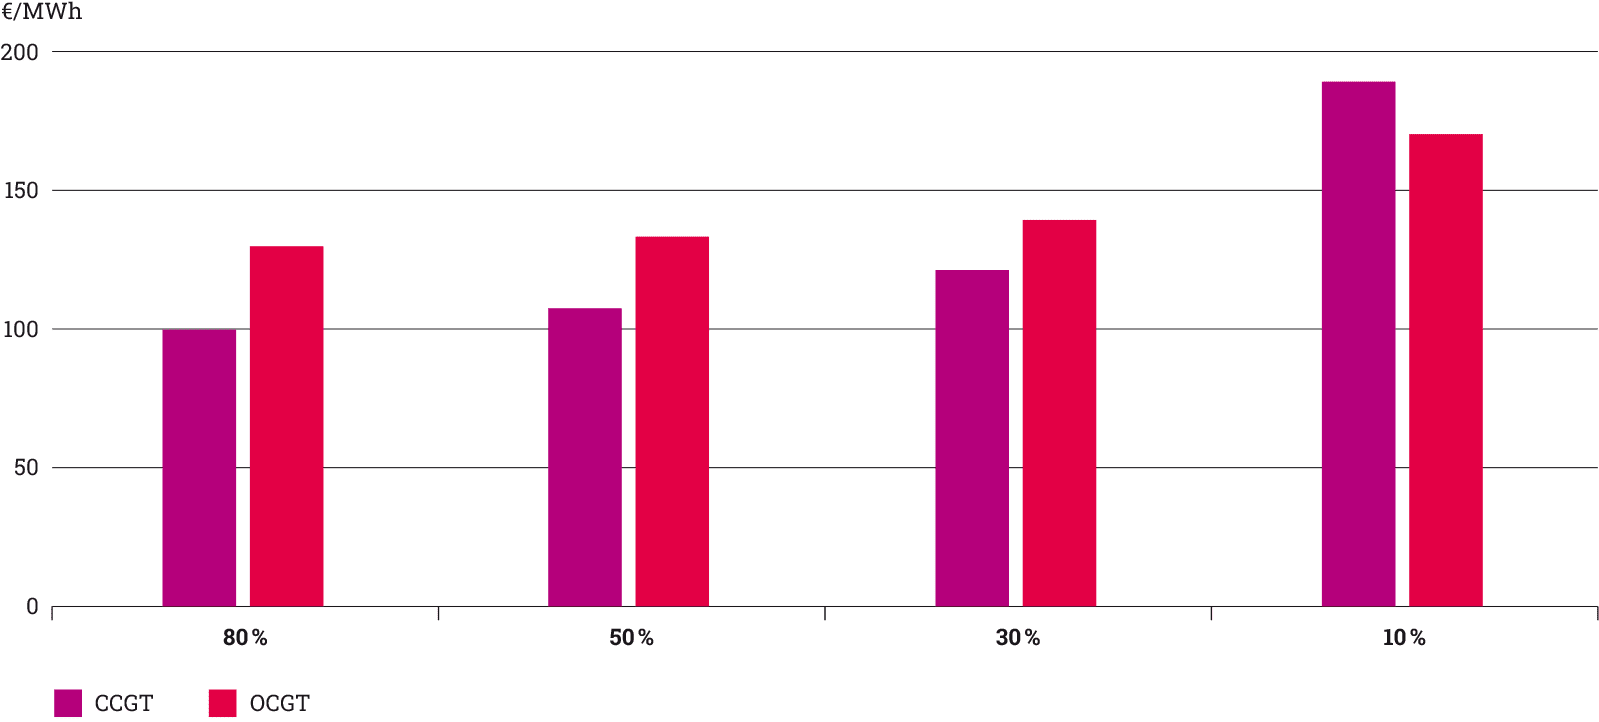
Figure 50: LCOE of flexible methane generation under different load factors – Distributed Energy 2040 (Fuel cost is based on a 57 %/30 %/13 % mix between natural gas, biomethane and synthetic methane with a CO₂ cost of 123 €/t CO₂. LCOE are very similar for Global Ambition.)
The previous graphs illustrate the cost assumed for wind and solar in each scenario based on their driver and the grid connection saving for RES dedicated to electrolysis. As a comparison with National Trends, the cost decrease focuses on:
- Solar PV and onshore wind in Distributed Energy is linked to the development of prosumer behaviour and decentralised focus;
- Wind offshore in Global Ambition linked to the development of large-scale RES solution.
The graphs also show the impact of running hours on the choice of flexible thermal generation. The increasing cost of fuels and CO₂ result in a premium for most efficient units with OCGT becoming competitive against CCGT for load factors between 10 % and 30 %.