
Scenario results
5.2 Supply
The scenarios explore contrasted possible evolutions of the energy market in Europe, and outside Europe, which translate into different primary energy mixes.
As COP 21 and Green Deal compliant scenarios, Global Ambition and Distributed Energy take a holistic approach to the European energy system, including all primary energy carriers, allowing the ENTSOs to compute the GHG emissions of the EU and to assess their compliance with the EU climate and energy targets and to compare them with the carbon budget.
National Trends is based on the different national policies and does not allow for a comprehensive and consistent interpretation of national data for all energy carriers and cannot be entirely assessed in this section.
5.2.1 Primary energy supply
The European energy supply decarbonises with the development of renewable capacities and energy efficiency measures.
Both Distributed Energy and Global Ambition aim at energy efficiency and decarbonization of the primary energy supply reaching around 20 % and 30–40 % reduction in primary energy demand in 2030 and 2050 compared to 2015. The electricity and gas production are fully decarbonised by 2040 and coal as well as oil are almost completely phased out by 2050.
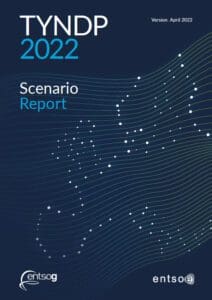
Natural gas supply declines sharply, in particular after 2030. By 2050 only 42 TWh of indigenous abated natural gas production are considered in Global Ambition. Overall, natural gas supply declines with between 91 % and 99 % compared to 2015 level.
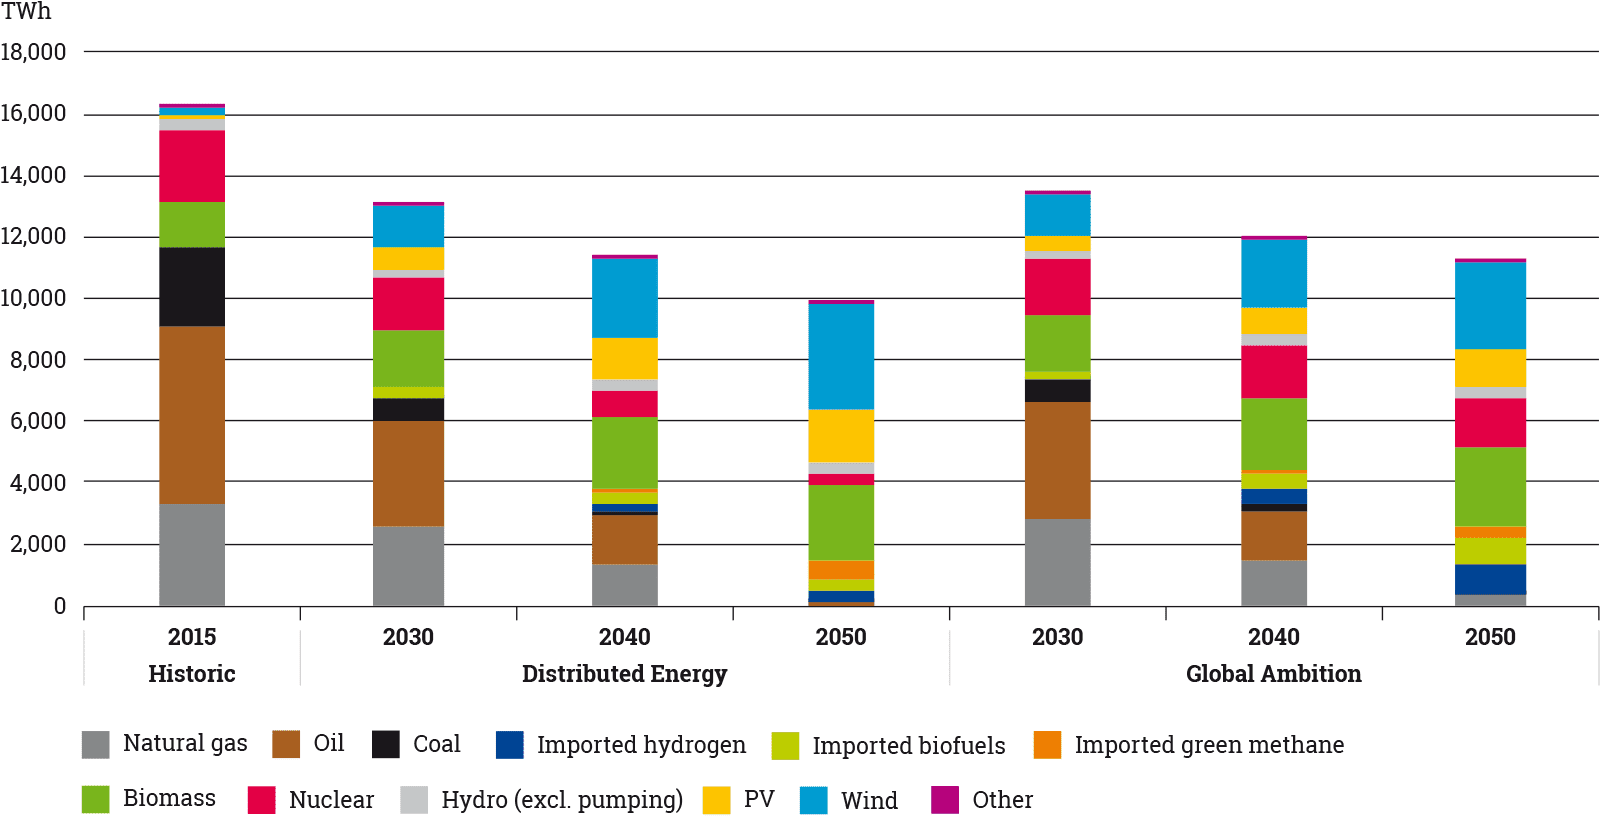
Figure 18: Primary energy supply in the two COP 21 scenarios (for energy and non-energy use) for EU27
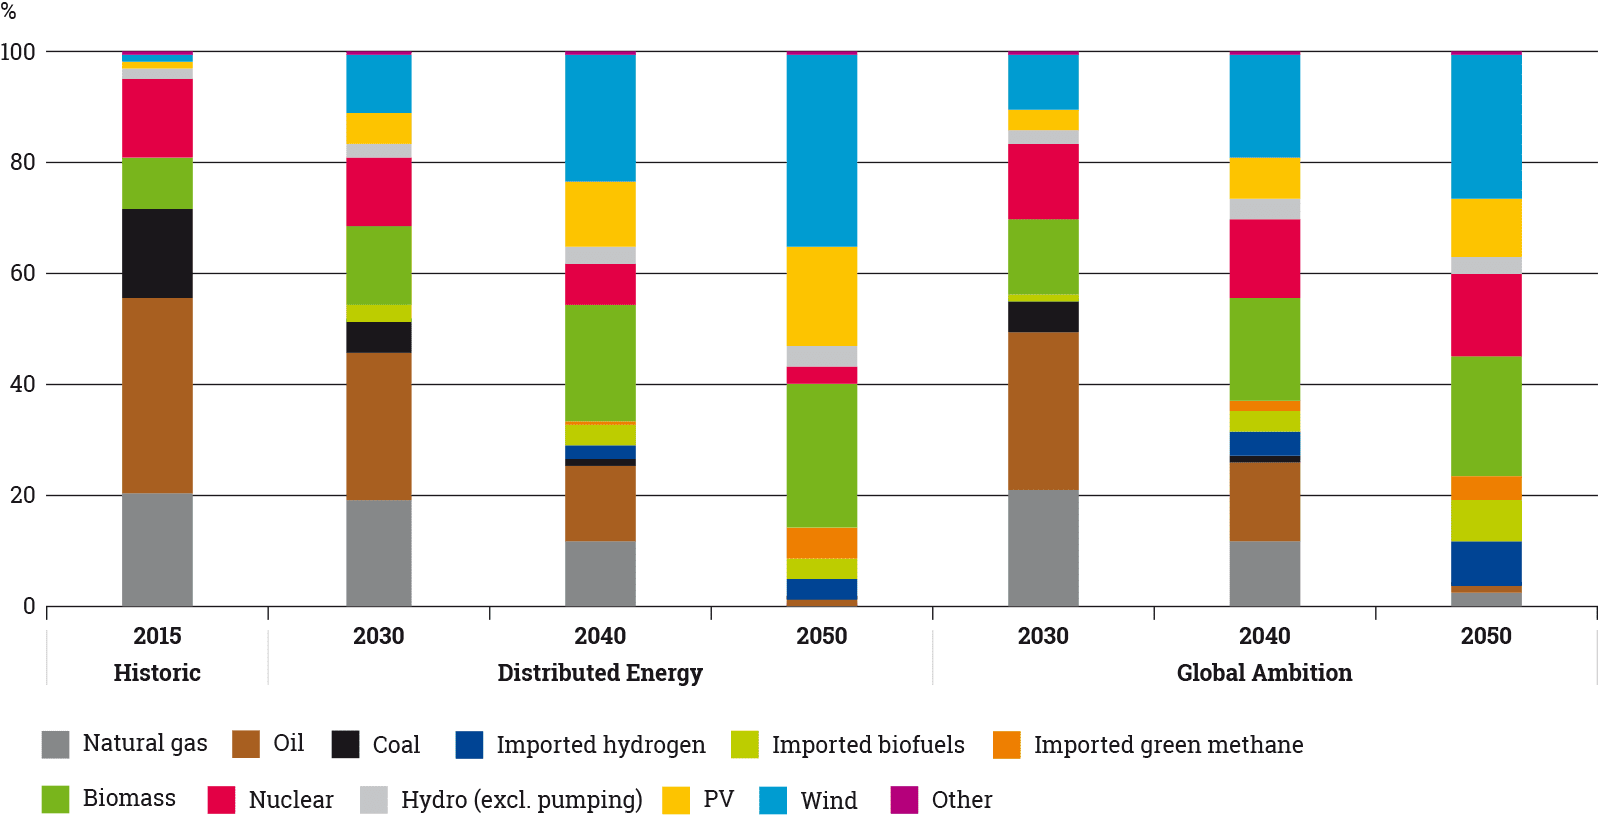
Figure 19: Primary energy supply mix in the COP 21 scenarios (for energy and non-energy us) for EU27
Both scenarios register a significant increase in renewables energy production. The renewable energy (RES) share in Global Ambition reaches 80 % by 2050 and 95 % in Distributed Energy. The vast majority of the energy supply stems from solar PV and wind generation. Renewable electricity production is complemented with biomass and energy from waste materials.
Low carbon sources like nuclear or blue hydrogen imports also contribute to decarbonise the energy system, especially in the Global Ambition scenario, with a market share between 3 % and 16 % of primary energy supply.
Figure 20: Share of fossil, low carbon and renewable energy in the primary energy supply mix (including non-energy)
5.2.2 Biomass supply
Both COP21 scenarios foresee an uptake of biomass supply compared to today’s level. The growth trajectory of biomass is similar in both scenarios. However it is slightly higher in Distributed Energy, as biomass generally represents a localised supply of wastes and other organic materials. This is illustrated in Figure 21. Biomass is used for different purposes in the scenarios.
It is directly used as final demand for heating and in industrial processes. Furthermore, biomass is used as a feedstock to produce biofuels, biomethane and electricity1. As such the biomass is converted to other energy carriers, which are subsequently used in the end use sectors for mobility, heating and other applications. The biomass potential used in both COP 21 scenarios are well below the max potentials stated by JRC.
1 The final demand and power generation categories only include the direct use of biomass. However, the biomethane produced from biomass is subsequently also consumed for these purposes.
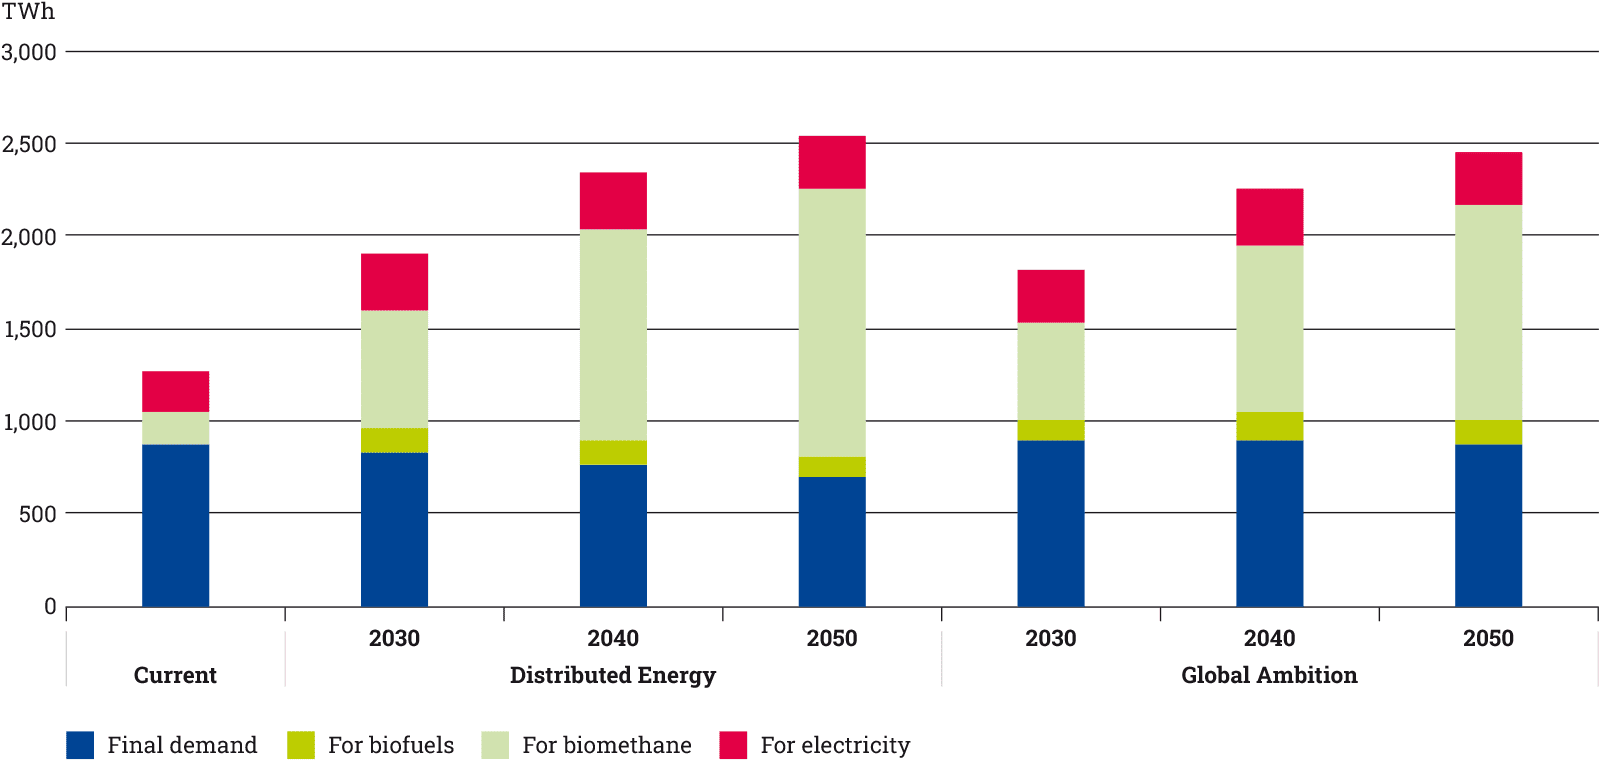
Figure 21: Biomass utilisation
5.2.3 Electricity supply
For electricity to fully play its role in the achievement of carbon neutrality in 2050, it is necessary to decarbonise its generation possibly before this time horizon. This is of particular importance when synthetic fuels (hydrogen, methane and liquids) are produced based on electrolysis.
Sector coupling induces a faster development of power generation as electricity has to supply both direct electrification and electrolysis-based energy (hydrogen, synthetic methane and liquids).
While all scenarios anticipate a development of electrolysis-based fuels, the magnitude of the associated electricity demand depends on the scenario storyline. The generation figures of the present chapter include the power generation for both final electricity demand and electrolysis.
In 2050, electricity demand for electrolysis accounts for close to one third of the overall electricity demand in both COP 21 scenarios.
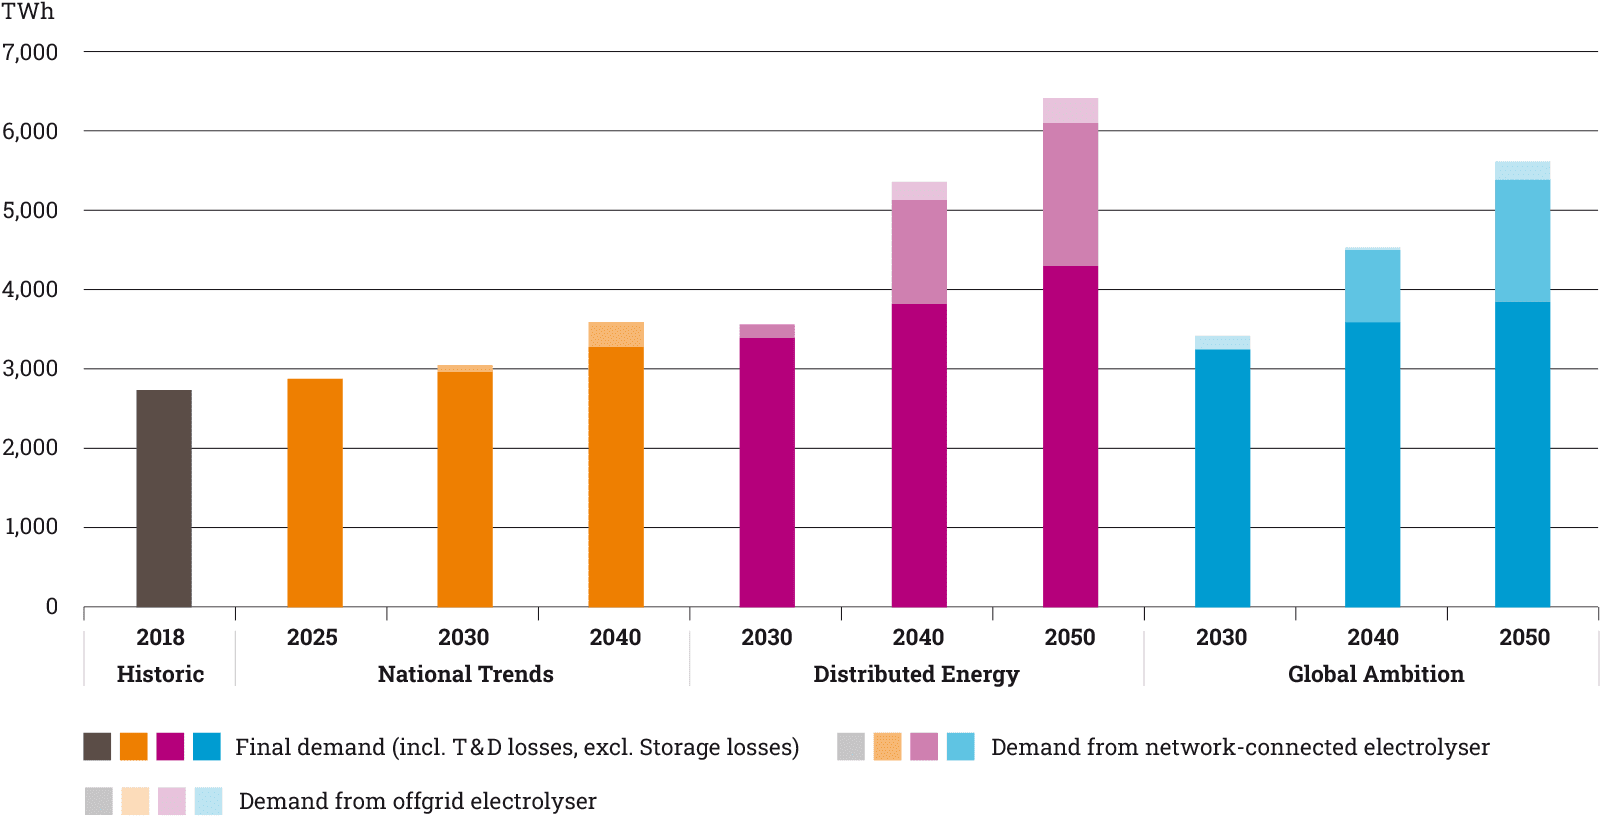
Figure 22: Electricity demand for final use and electrolysis for EU27
These scenarios follow the line of an early reach of carbon neutrality of the power generation mix. In 2040, renewable (e. g. wind, solar and gas-fired power plants using renewable methane or hydrogen) and nuclear power generation amount to around 95 %2 of EU27 electricity supply in Global Ambition and Distributed Energy (including dedicated wind and solar for electrolysis). In 2050, variable renewables (wind and solar) are the major source with respectively 82 % and 73 % of power generation in Distributed Energy and Global Ambition compared to 57 % to 54 % in 2030 and 15 % in 2018. In 2050, the electricity generation is almost completely decarbonised3 and amounts to 6,320 and 5,615 TWh for respectively Distributed Energy and Global Ambition.
While wind, solar, gas-fired power plants using renewable methane or hydrogen, and nuclear capacity differs between the COP 21 scenarios, these technologies are complemented by a wide range of other renewable energy sources (e. g., hydro, biomass…) which capacity is the same for all scenarios based on bottom-up data as strongly influenced by country specifics. Among these other renewable energy sources, hydro is the most prominent. It is currently the largest source of renewable energy, with 342 TWh4 produced in 2018. While its share will reduce with the development of wind and solar, the capacity will continue to increase from 136 GW in 2018 to 169 GW in 2030 and produced in 2018. While its share will reduce with the development of wind and solar, the capacity will continue to increase from 136 GW in 2018 to 169 GW in 2030 and 174 GW in 2040.
2 Assuming a share of renewable methane (resp. hydrogen) of 39 % (resp. 83 %) in Distributed Energy and 36 % (resp. 72 %) in Global Ambition in 2040
3 At the exception of small thermal power plants such as CHP answering local needs
4 including reservoir, run-of-river and pump storage
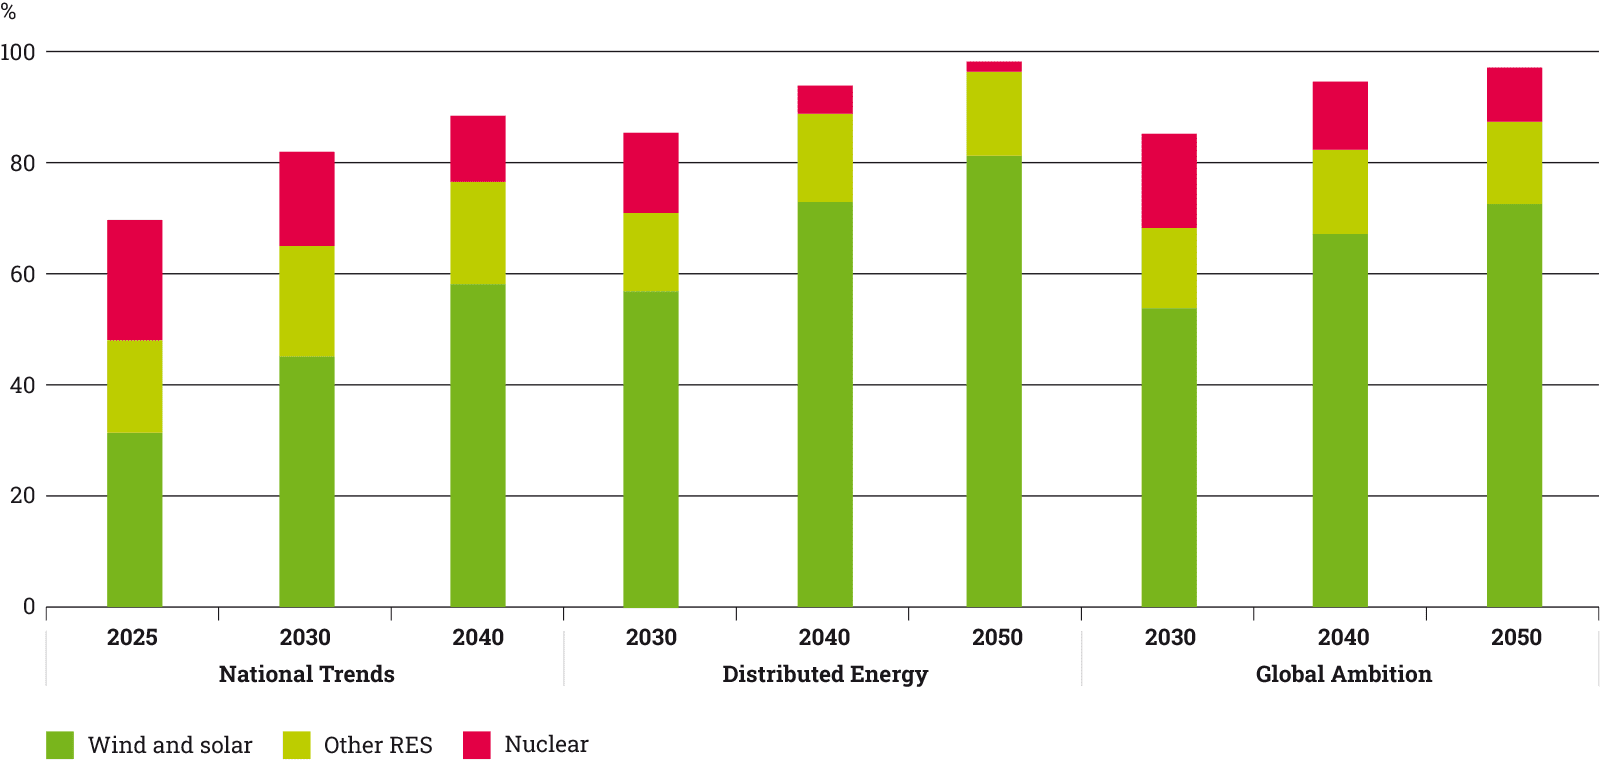
Figure 23: Share of electricity demand covered by low carbon generation in EU27
A strong increase in wind and solar capacity is constitutive of all scenarios, but the magnitude depends on the storyline of each scenario.
In Distributed Energy, a focus on lowering nuclear capacity and energy imports supplement the decarbonisation objective. As a result, investment in wind and solar capacity reaches the highest level in order to meet both direct electrification and the need for synthetic fuels to replace imports. From a technology perspective, there is an emphasis on decentralised sources such as onshore wind and solar PV. As they have lower load factors than offshore wind, the need for installed capacity increases sharply. In accordance with more developed prosumer behaviour in Distributed Energy, rooftop PV capacity reached 561 GW in 2050 for Distributed Energy in comparison with 399 GW for Global Ambition. Even if offshore wind is not a predominant technology in this scenario compared to Global Ambition, the renewable electricity needs are such that this technology sees a significant development.
In Global Ambition, final electricity demand is slightly lower than in Distributed Energy while electricity demand for synthetic fuels is lower due to the ability to import low-carbon molecules therefore the total electricity supply increases slower.
While nuclear capacity will decrease in some extent compared to today (moving from 139 GW in 2018 to 86 GW in 2050), new nuclear units will partly compensate the decommissioning of existing ones. As a result, the need for wind and solar capacity will be strong but lower than in Distributed Energy (1,959 GW in 2050 to compare with 252 GW in 2018 and 2,802 GW in 2050 for Distributed Energy).
In line with their respective storylines, Distributed Energy mostly relies on onshore wind and solar (34 % and 28 % of the total power generation) while in the Global Ambition scenario, offshore wind is the first energy source (26 % of the total power generation) in 2050.
Compared to the TYNDP2020 edition, National Trends, which is based on national strategies and policies, shows a higher ambition in terms of electricity demand and renewable generation share compared to the TYNDP2020 edition. It illustrates the integration of the Green Deal ambition at national level. Electricity generation5 reaches 3,160 TWh in 2030, 3,809 TWh in 2040 compared to 2,775 TWh in 2018.
The share of low carbon and renewable generation reaches 82 %6 in 2030 and 89 % in 2040. Wind and solar capacity reaches 706 GW in 2030 and 1,025 GW in 2040.
5 excluding batteries, DSR and hydro pump storage
6 Assuming a share of renewable methane of 4 % National Trends in 2030
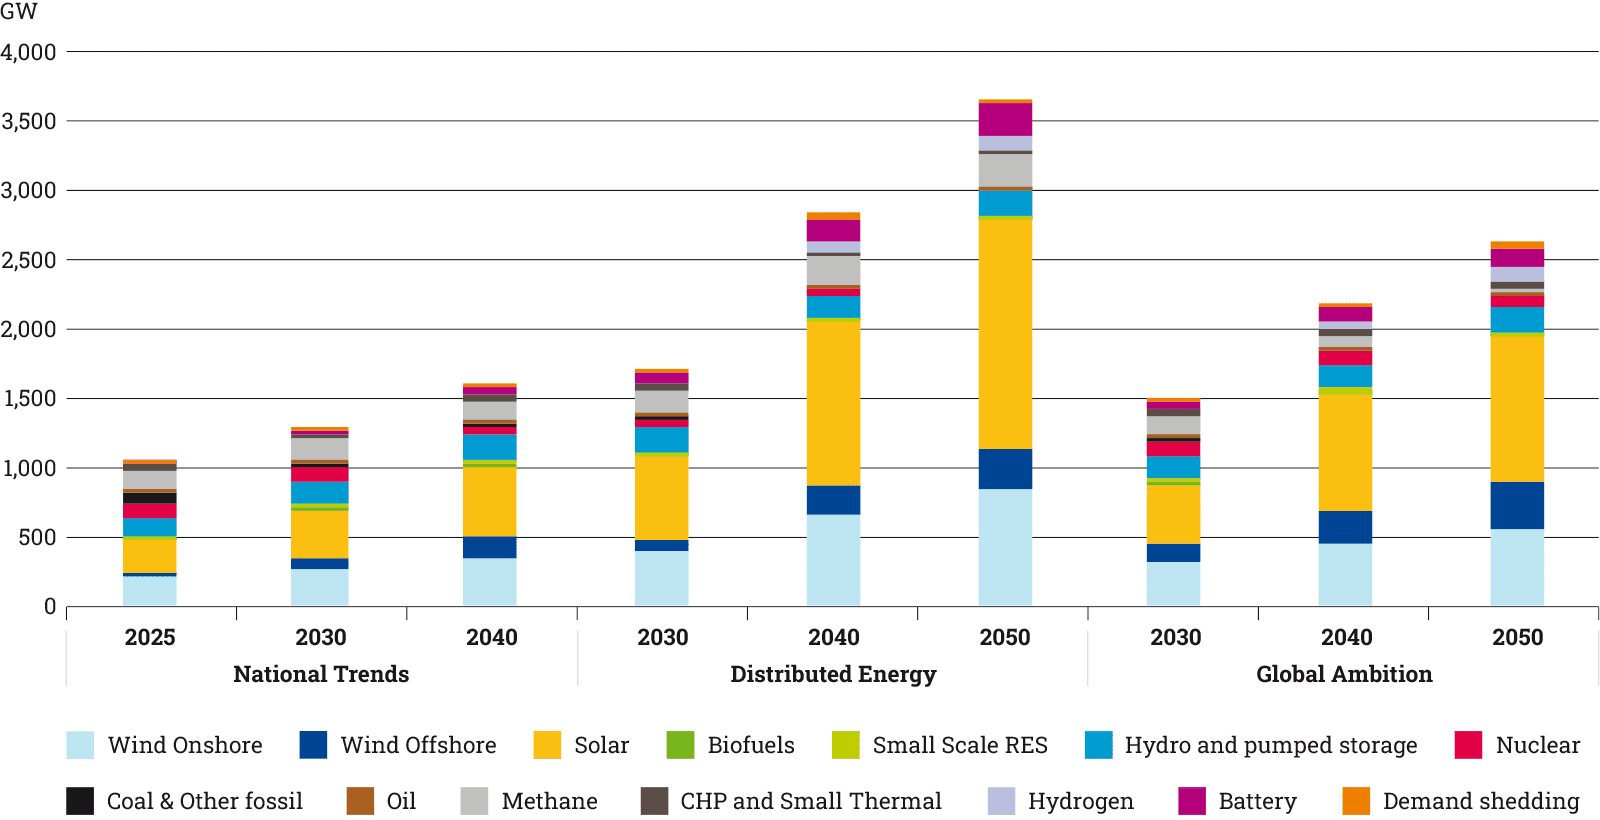
Figure 24: Capacity mix for EU27 (including prosumer PV, hybrid and dedicated RES for electrolysis)
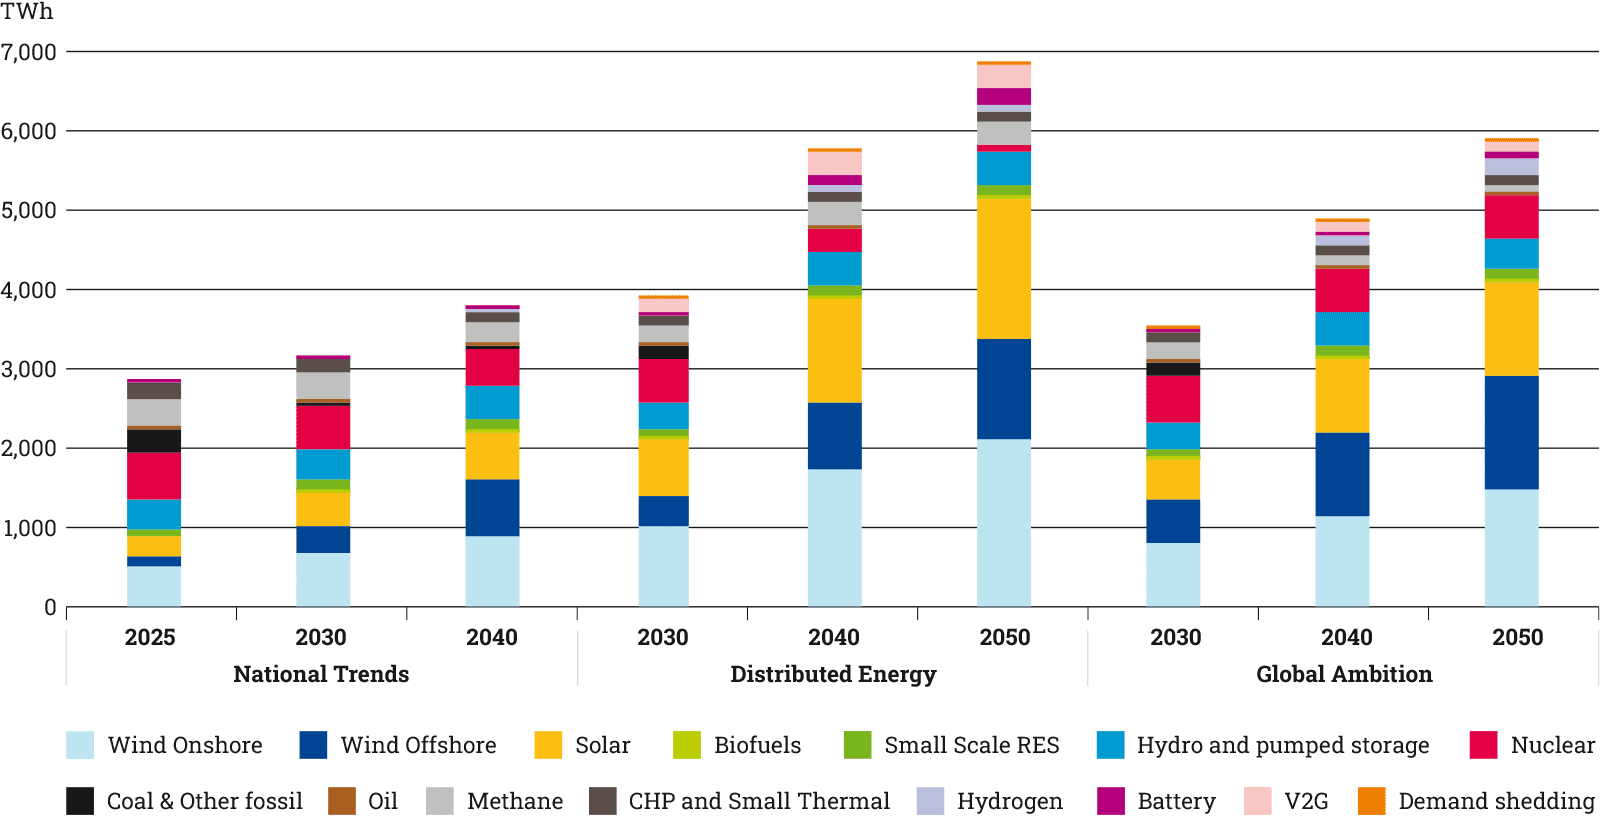
Figure 25: Power generation mix for EU27 (including prosumer PV, hybrid and dedicated RES for electrolysis)
In all scenarios, coal and lignite are under pressure of phase-out policies in many countries as well as high CO₂ price. In 2030 beyond small units (e. g., CHP), they only represent around 170 TWh in Distributed Energy, Global Ambition and National Trends in comparison with 540 TWh in 2018. At European level, the role of these two sources becomes negligible in 2040.
The role of gas in power generation strongly evolves along the time horizon. First there is a need to distinguish methane from hydrogen. In the present scenarios the increasing role of hydrogen in final demand translates into a similar evolution for gas-fired power generation replacing progressively part of methane in this sector for the 2040- and 2050-time horizon.
Secondly, methane is progressively decarbonised offering the opportunity of flexible renewable and low carbon generation. While methane is now mostly natural gas, the share of biomethane increases along the time horizon to become fully decarbonised by 2050 in Distributed Energy, as illustrated in Figure 31 on Methane supply.
Finally, the development of variable RES at zero marginal cost has a strong influence on the way that thermal plants are operated (which is also true for nuclear in a lower extent). Due to the coal and nuclear phase-out in many countries, gas-fired power generation will play a more important role to support the development of RES, gradually moving from an electricity to a flexibility source over time. It is pictured by the path followed by capacity and generation.
For Distributed Energy and Global Ambition, capacity increases up to 2040. In Distributed Energy, capacity further increases in 2050 to support the adequacy of an electricity system where wind and solar provides 81 % of the generation. In Global Ambition, capacity stays stable due to a lower RES development.
From an energy perspective, gas-fired power generation follows the capacity trend up to 2040. Regarding Distributed Energy 2050, gas-fired power generation shifts to the role of rather providing flexibility. For Global Ambition, a slower electrification is supported by a larger range of technologies including gas-fired power generation relying more on renewable and low carbon methane and hydrogen (either produced).
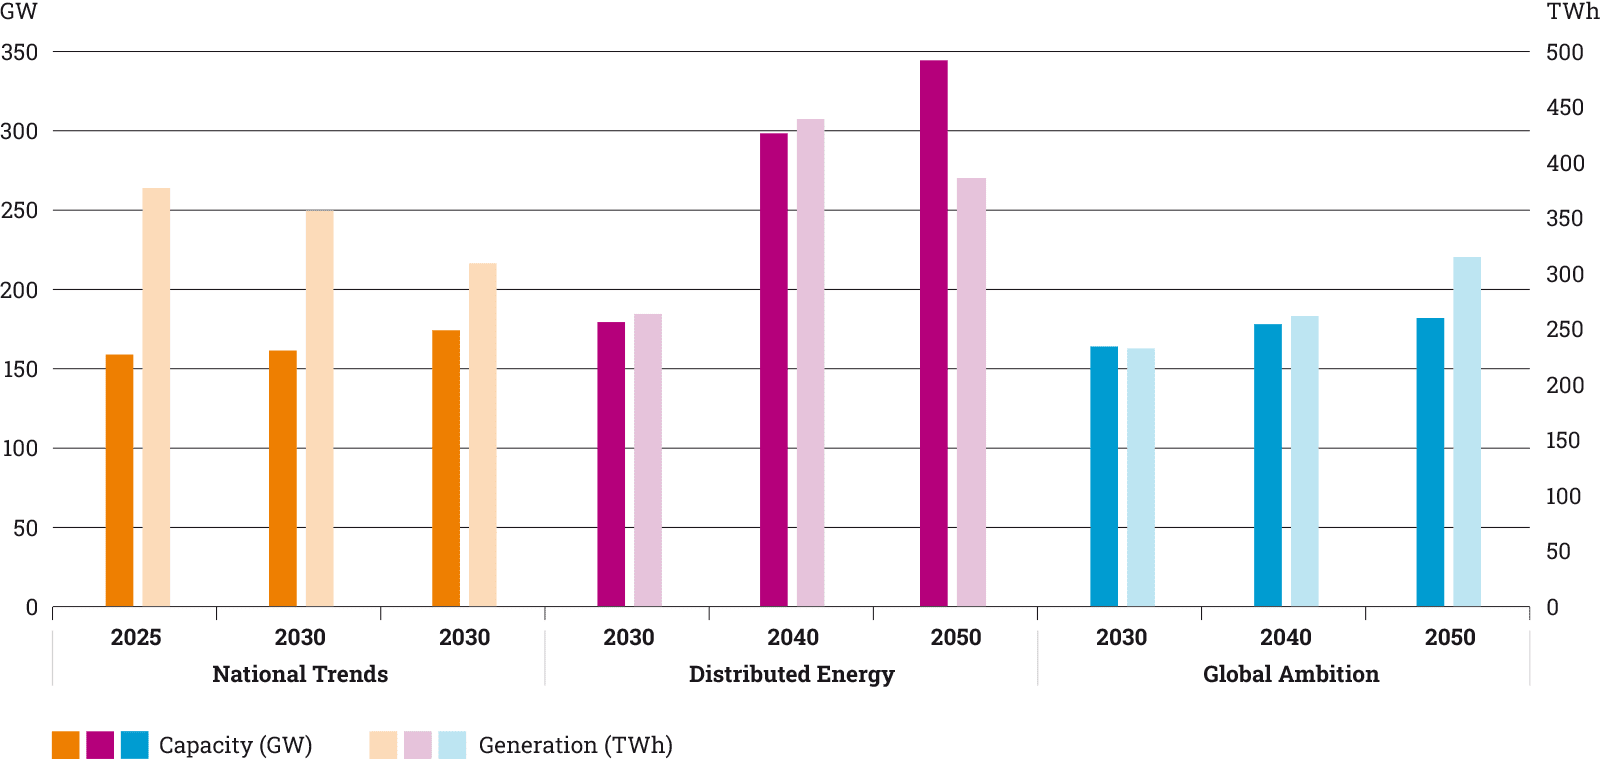
Figure 26: Evolution of the main methane and hydrogen fired power capacity and generation for EU27 (Excluding Small Thermal and CHP which operation can be driven by other factors such as heat production)
In both COP21 scenarios, the full load hours of methane and hydrogen fired power generation is much lower than present level. It will certainly trigger new challenges in terms of market design which are beyond the remit of the present report.
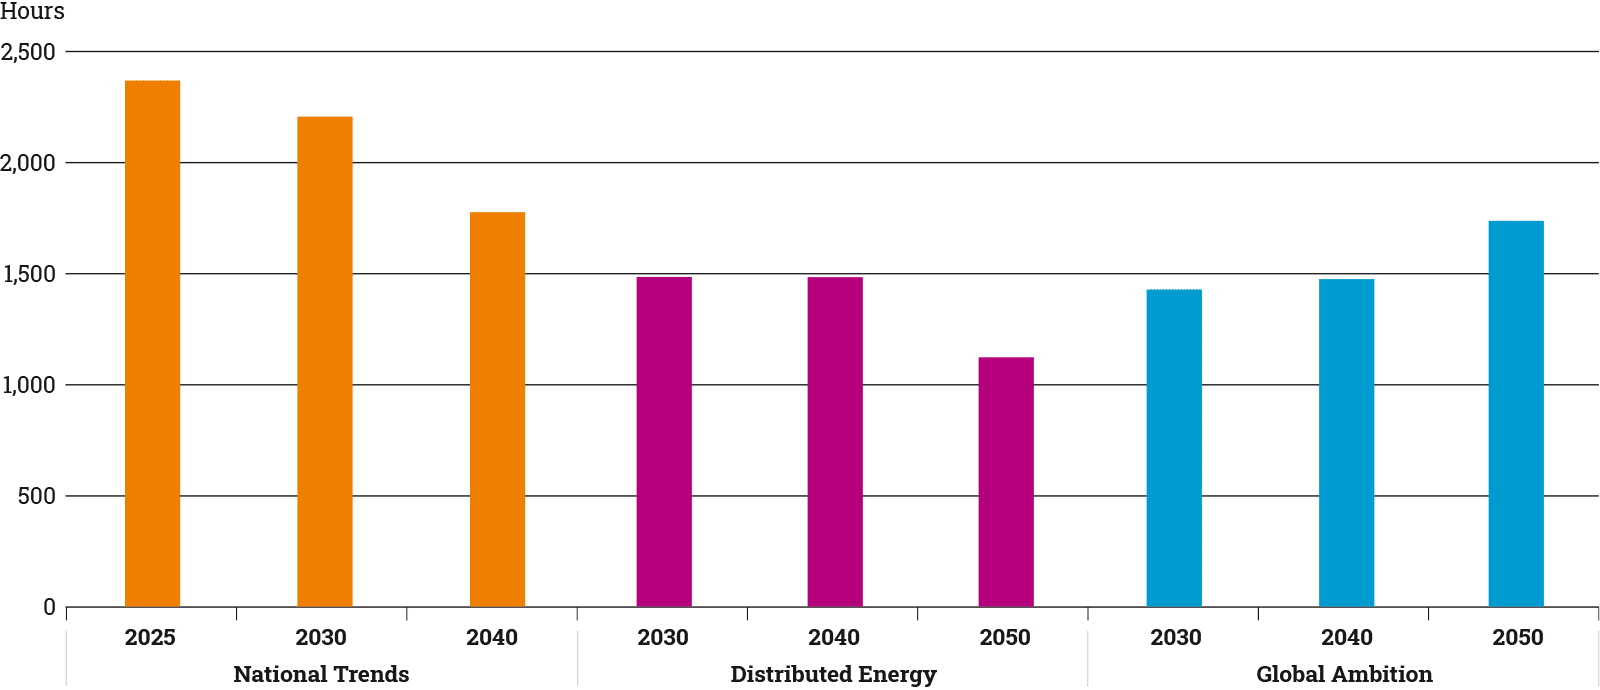
Figure 27: Evolution of full load hours of the main methane and hydrogen fired power generation units for EU27 (Excluding Small Thermal and CHP which operation can be driven by other factors such as heat production)
When Other Non-Renewables (mainly small-scale CHP) play a lesser role in the European electricity system today, they also need to be decarbonised in order to be able to achieve carbon neutrality. For CHP still using fossil fuels, it means either a switch to low-carbon equivalent or decommissioning on the long run.
Flexibility options go beyond dispatchable power generation. COP21 scenarios rely on a wide range of technologies:
- Demand side response captures the change in load pattern to react to price signals. According to the modelling methodology it covers demand shedding, prosumer batteries, vehicle-to-grid (V2G), hybrid heat pumps and district heating heat pumps7
- Utility scale batteries
- Hydro pump storage
- Electrolyser coupled with downstream flexibility
7 In the 2022 methodology, hybrid and district heat pump profile is optimized based on temperature. The capability to adapt to wholesale market price is not modelled (see Scenario Building Guidelines).
Flexibility need will increase as well as the range of technologies to answer it. The electrification of the heating sector and the development of wind and solar will increase the climate dependency of the electricity system. At the same time, the impact of global warming on the variability of weather conditions can already be observed. As a result, the decarbonisation of the electricity mix must go in parallel with the development of flexibility solutions in order to maintain the security of supply. The extent of the flexibility needs and the development of technologies to meet depend on the scenario storylines. Beyond hydro pump storage which capacity follows the same path (increasing up to 2040), the COP21 scenarios differ in the balance between upstream flexibility (generation side) as today and downstream flexibility (consumer side).
In Distributed Energy, the climatic exposure will be at the highest as a result of heating electrification and maximum wind and solar development. At the same time flexible power generation (including nuclear) will decrease.
In addition, the development of prosumer behaviours will result in a high development of residential batteries and V2G services providing short term storage solutions. The development of district heating will also contribute to an optimized use of connected heat pumps mitigating the challenge of peak demand for space heating. Finally, the need to produce synthetic fuels to replace imports will also offer the opportunity of seasonal flexibility by coupling the electricity and hydrogen systems. Electrolysis and hydrogen storage will then be beneficial to the security of the energy system.
In Global Ambition, the climatic exposure of the electricity system will increase relatively slower both on the demand and supply side. The commissioning of new nuclear units will also provide some degree of flexibility. The development of demand side response will be less critical and battery development will rather focus on utility-scale batteries.
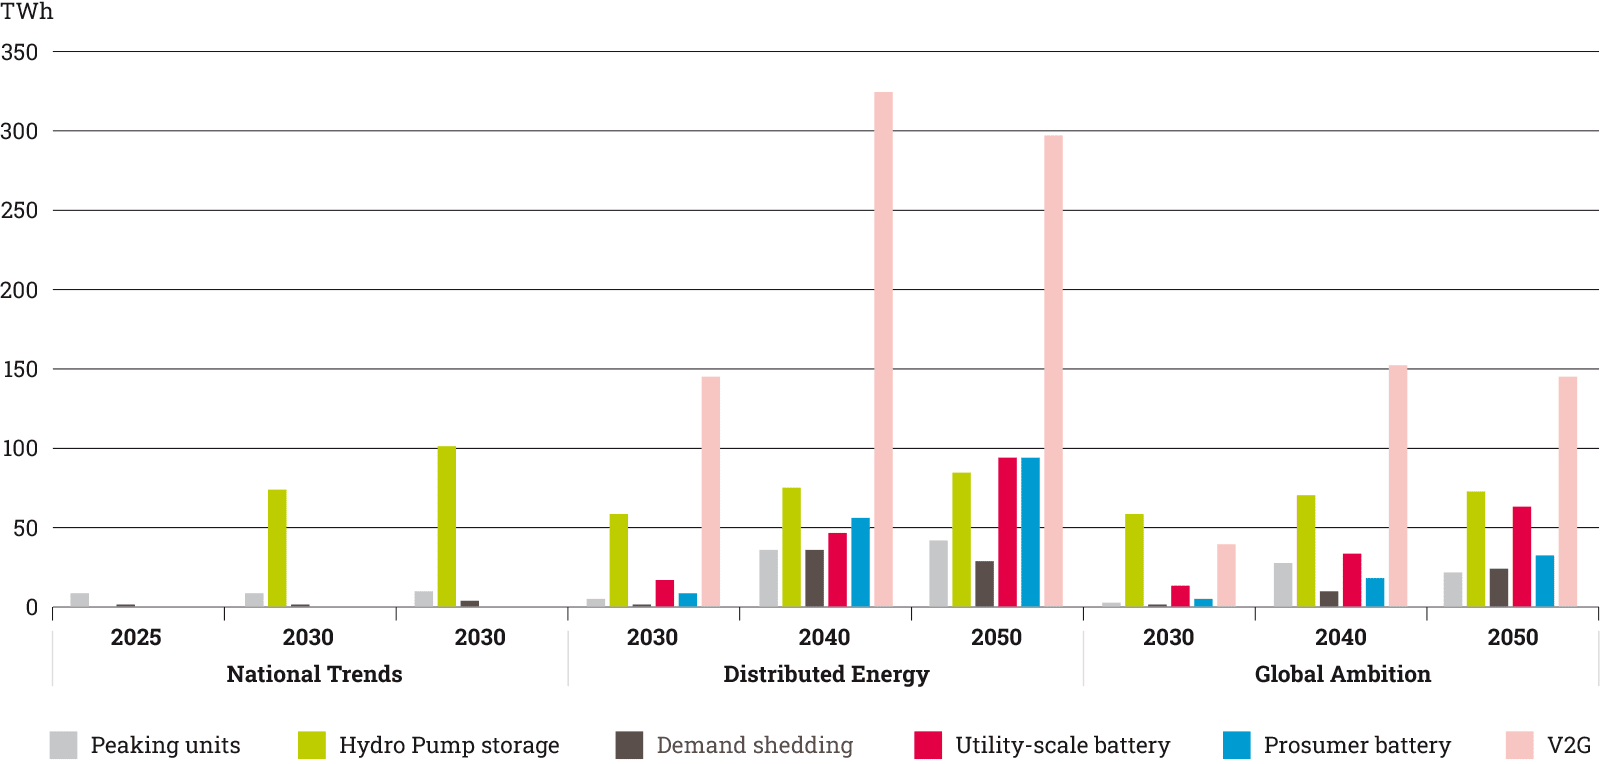
Figure 28: Main flexibility sources for adequacy for EU27 (Peaking units are to be understood as methane-fired open cycle units and peakers as resulting from the new adequacy step. Battery cover utility-scale and prosumer installation)
Focus on system operation under various climatic situation.
The influence of climatic conditions on the electricity system will significantly increase as a result of the electrification of space-heating and the development of wind and solar.
In order to illustrate how the adequacy of the electricity system adapts to climatic situations (in particular to wind availability), the following graphs show the hourly balance on 2-week periods of the climatic year 19958.
8 Climatic year of highest residual demand based on Distributed Energy RES capacity and demand profile

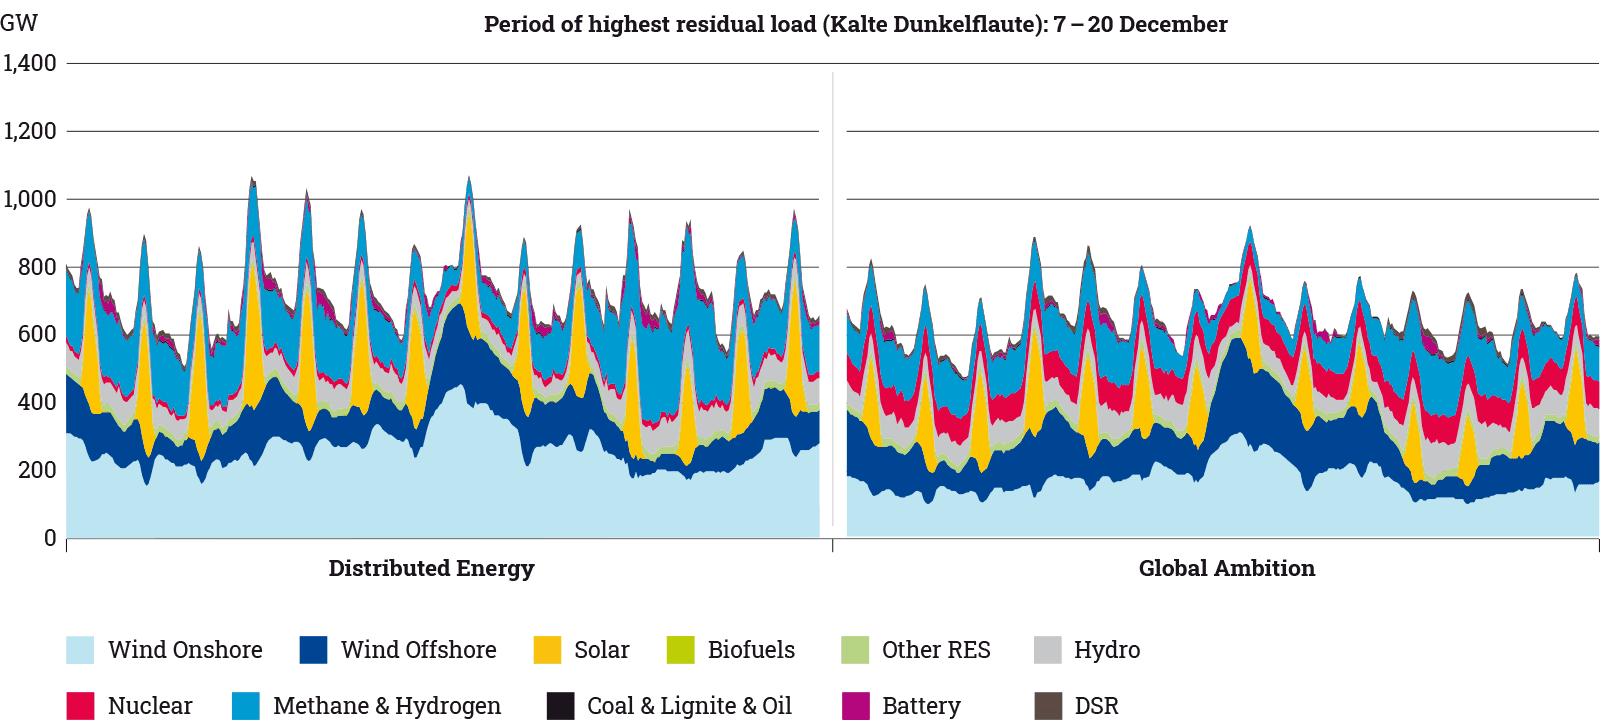
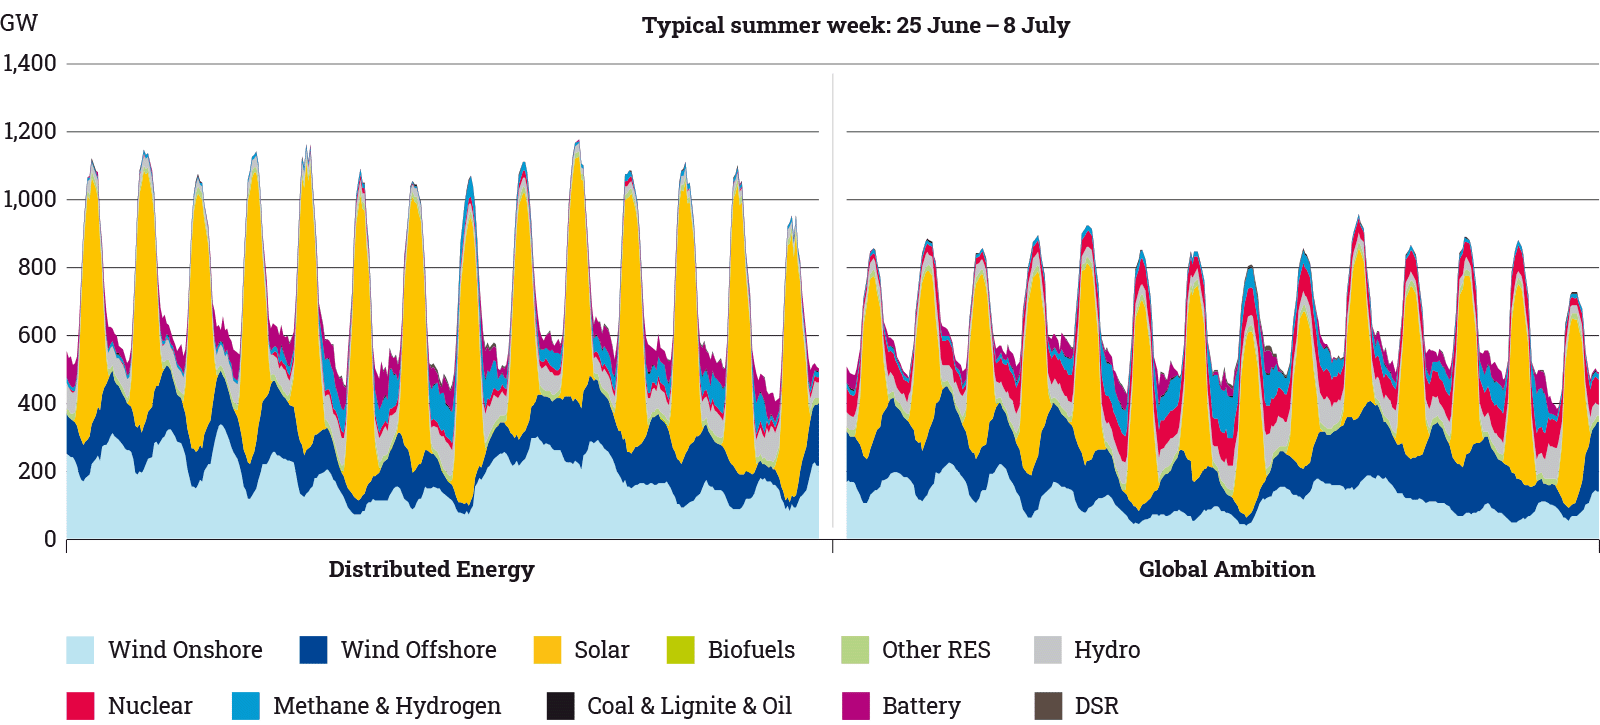
Figure 29: Hourly generation profile of power generation
(Distributed Energy, left – Global Ambition, right; excluding RES dedicated to Power-to-Methane from the P2G Configuration 5)
5.2.4 Gas supply
All renewable and decarbonisation technologies are needed to meet the EU energy and climate objectives.
The decarbonisation of the gas supply can be done in many ways. Gas can either be produced from renewable energy such as biomass producing biomethane or wind and solar energy producing hydrogen. Furthermore, decarbonised hydrogen can be produced with natural gas with different technologies such as steam methane reforming (SMR)/autothermal reforming (ATR) associated with carbon capture and storage technologies9.
Both COP 21 scenarios consider all types of technologies to a greater or lesser extent following their storyline. Each technology comes with its level of decarbonisation that is considered in the computation of the GHG emissions of each scenario to keep track of their carbon budget expenses. For instance, biomethane can be considered as carbon neutral or carbon negative if associated with CCS10.
9 For SMR/ATR an overall efficiency factor of 77 % is used. For CCS processes a capture rate of 90 % is considered. This capture rate represents the various methane reforming technologies and takes into to account the part of the CO₂ that cannot be captured in the process and that is therefore released in the atmosphere.
10 Also known as bio-energy carbon capture and sequestration (BECCS)
The EU gas production can decarbonise by 2040 in both COP 21 scenarios.
With the development of renewable hydrogen, biomethane and decarbonisation technologies, the EU can decarbonise its gas production by 2030 in Global Ambition and by 2040 in Distributed Energy. The EU indigenous production is largely decarbonised in 2040 in National Trends but not entirely with about 100 TWh of remaining unabated Natural gas.
Distributed Energy shows the highest development of indigenous production capacities (about 2,450 TWh produced in 2050) and a higher role for biomethane and hydrogen since local production is prioritised. In Global Ambition, the indigenous production of methane and hydrogen also significantly increases (roughly 2,250 TWh produced in 2050) but to a lesser extent compared to Distributed Energy.
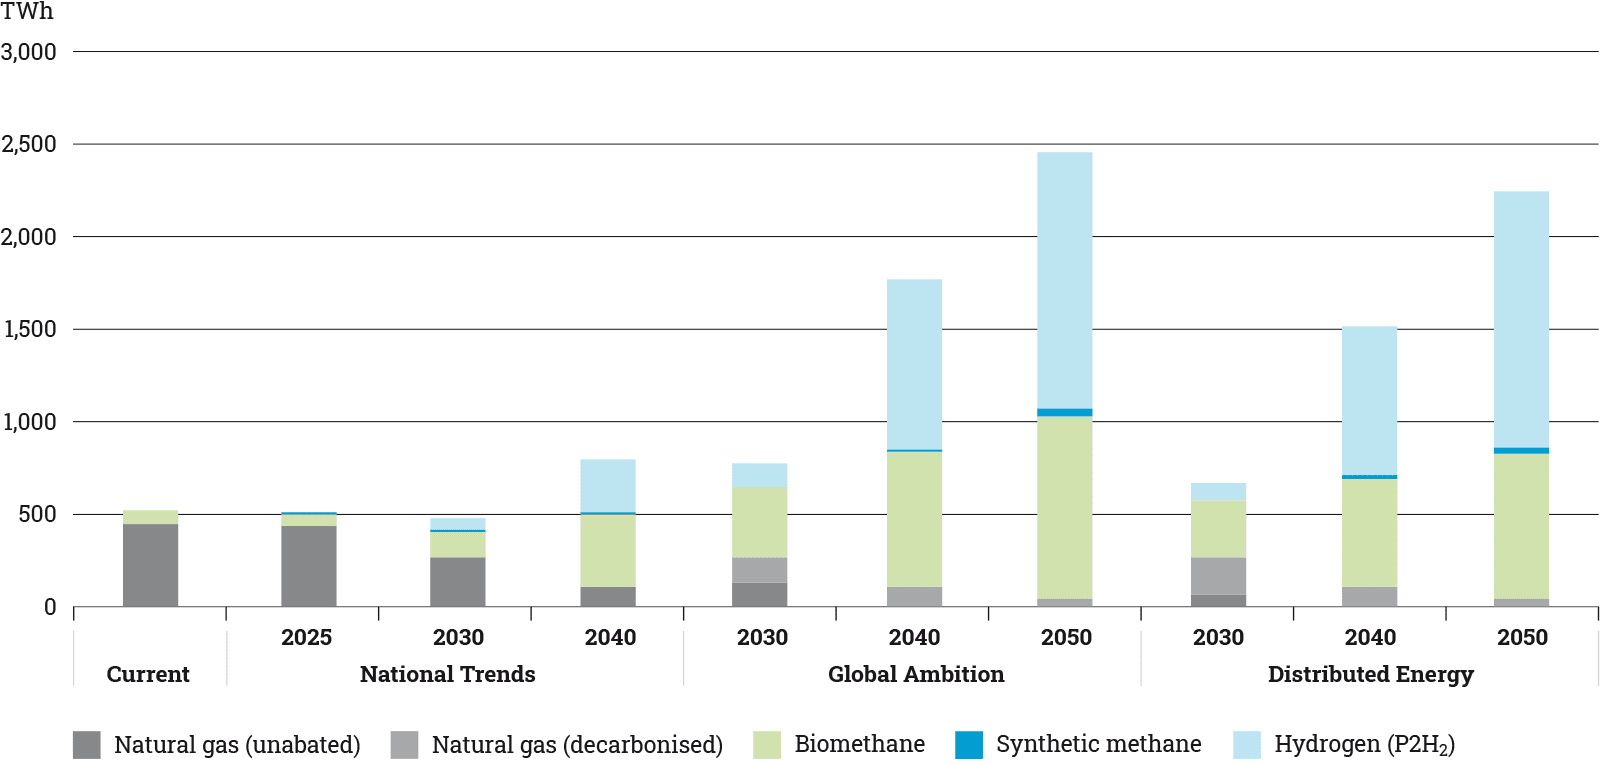
Figure 30: EU27 annual gas production per scenario
5.2.4.1 Methane supply
Figure 31 provides an overview of the methane supply in all three TYNDP 2022 scenarios. All scenarios consider similar decrease of the conventional indigenous natural gas production. The indigenous renewable methane production, such as biomethane and synthetic methane, differ across the scenarios in accordance with the storylines.
National Trends shows an increase of biomethane production over time and the production of synthetic methane through electrolysis is rather limited. The overall production of renewable gases is enough to compensate for the decline in conventional natural gas, in order to maintain current EU gas production. However, as the reduction in the methane demand starts later than in the other scenarios, National Trends shows the highest import dependence on methane until 204011.
11 As the GHG emissions are not assessed for National Trends, the production means of the imported methane (fossil, low carbon, renewable) is not specified.
Biomethane: an essential source of renewable methane.
Biomethane plays a major role in the decarbonisation of the methane supply and is the main source of decarbonisation of the gas supply in both COP 21 scenarios until 2035.
Synthetic methane and renewable imports are key to complement the supply needs and reach carbon neutrality by 2050.
Import levels are reduced and decarbonised by 2050 in both COP 21 scenarios.
As a scenario focusing on energy autonomy, Distributed Energy considers a high level of indigenous production of renewable and decarbonised methane. With around 980 TWh in 2050, Distributed Energy projects the highest biomethane production of all scenarios12. The same accounts for the production of synthetic methane, with an amount of 40 TWh in 2050. On the other side, imports are reduced from 86 % to 33 % between 2020 and 2050, accounting for 1,382 TWh in 2040, and 534 TWh in 2050. The level of imports in Distributed Energy is the lowest of all three scenarios and does not consider any natural gas in 2050.
As a scenario focusing on the integration of the EU into the global energy transition, Global Ambition combines both high decarbonisation levels and access to global and diversified markets for renewable methane (1,279 TWh in 2050). Furthermore, thanks to energy efficiency measures, methane imports decrease from 86 % to 46 % by 2050. Natural gas imports reduce from about 3,250 TWh to 260 TWh in 2050, essentially to be decarbonised to produce hydrogen.
12 See TYNDP 2022 scenario building guidelines for the potential of EU27 biomethane production.
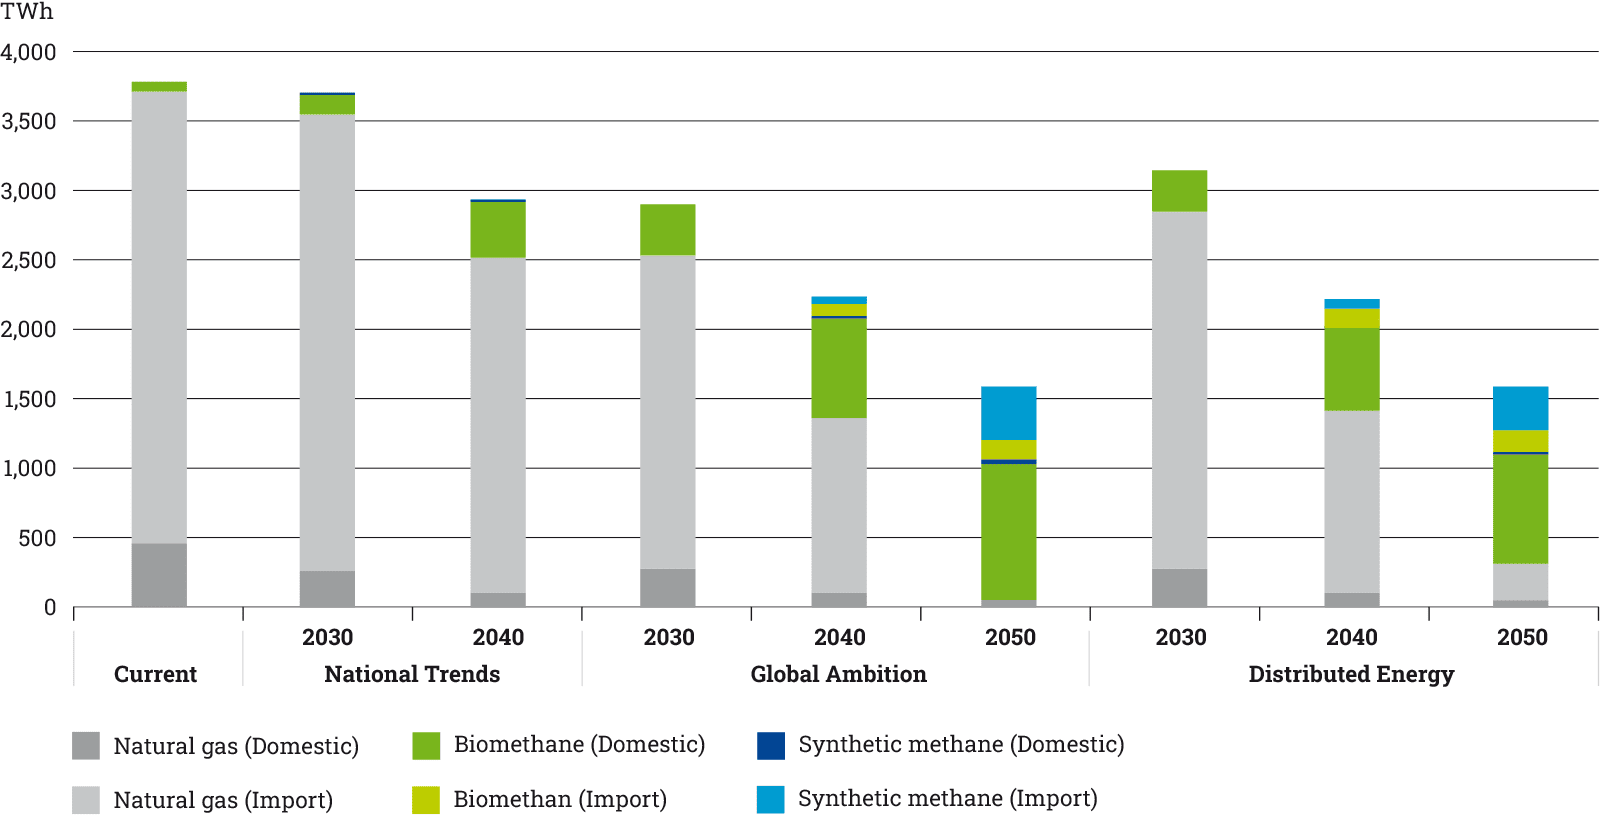
Figure 31: Methane supply for EU27
5.2.4.2 Hydrogen supply
A game changer.
Today the EU-27 hydrogen supply is a domestic production of about 350 TWh, mainly used as a feedstock. About 75 % is produced with SMR/ATR, the remaining volumes are by-products from other industrial processes. However, both COP21 scenarios consider the hydrogen market will undergo a complete transformation over the next 30 years and be traded mainly as an energy carrier to become the main gas energy carrier by 2050 with a marginal role for its demand as feedstock.
The main drivers of this transformation of the hydrogen market are the significant EU and global potentials for producing hydrogen from variable renewable electricity and water, including sea water. Figure 32 provides an overview of the hydrogen supply in the three TYNDP 2022 scenarios.
13 As part of the hydrogen supply is produced with natural gas, methane and hydrogen demand should not be summed.
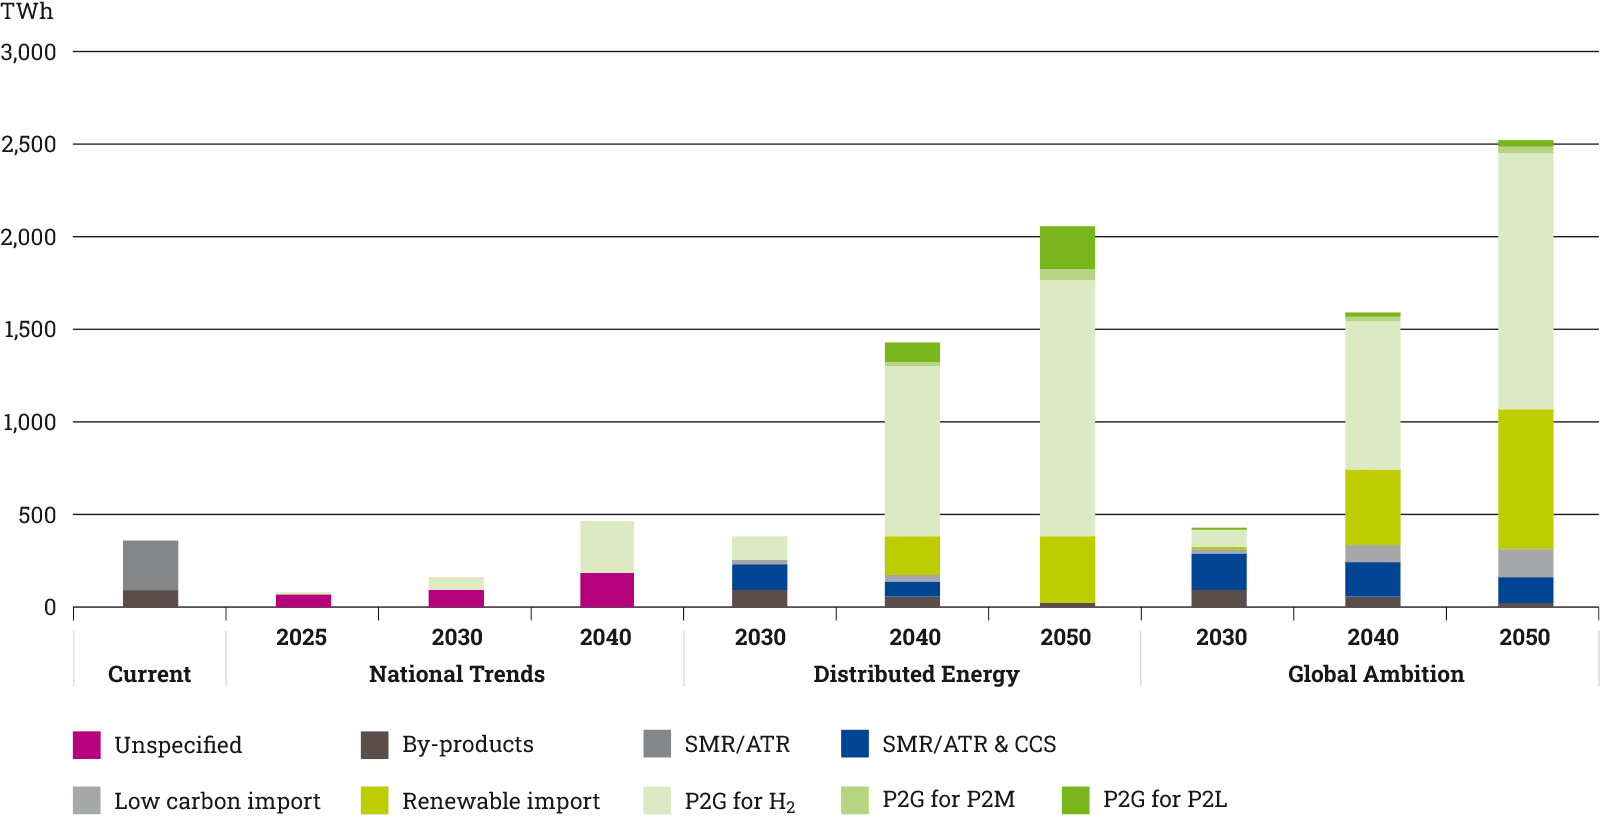
Figure 32: Hydrogen supply for EU27
National Trends considers a limited uptake of hydrogen production.
National Policies generally reflect various and shorter-term visions of the EU Member States. And most policies have not been significantly updated since the NECPs were published in 2019. Therefore, the role of hydrogen to meet the 2050 objectives is not always fully captured by the National Trends scenario (for some countries this also applies for Distributed Energy and Global Ambition).
Most of the current hydrogen produced locally in the industrial clusters is not included in the figures since they are not connected to any regional or national networks. These figures are shown as methane demand.
COP 21 scenarios: the key role of hydrogen to decarbonise the energy system.
Both Distributed Energy and Global Ambition integrate all sectors to provide a holistic vision of the European energy system.
Distributed Energy, as a decentralised scenario with high energy autonomy, considers a high level of domestic production of renewable hydrogen – similar to the high domestic methane production. Since both decarbonisation and higher self-sufficiency are the main drivers of the Distributed Energy Scenario, it requires a significant increase in renewable electricity generation to meet the P2G demand (1,674 TWh in 2050) and electricity demand. The uptake of hydrogen imports is limited (358 TWh renewable hydrogen in 2050), with an import share of 17 %.
Global Ambition, as a scenario considering larger scale solutions and the EU as an actor of the global energy transition, combines both high decarbonisation levels with access to a global and diversified clean hydrogen market. Hydrogen produced from renewables in the EU play an important role in the supply mix (1,455 TWh) and clean hydrogen imports are key to ensure the supply and demand adequacy of the EU, providing 901 TWh of decarbonised and renewable hydrogen, resulting in an import share of 36 %.
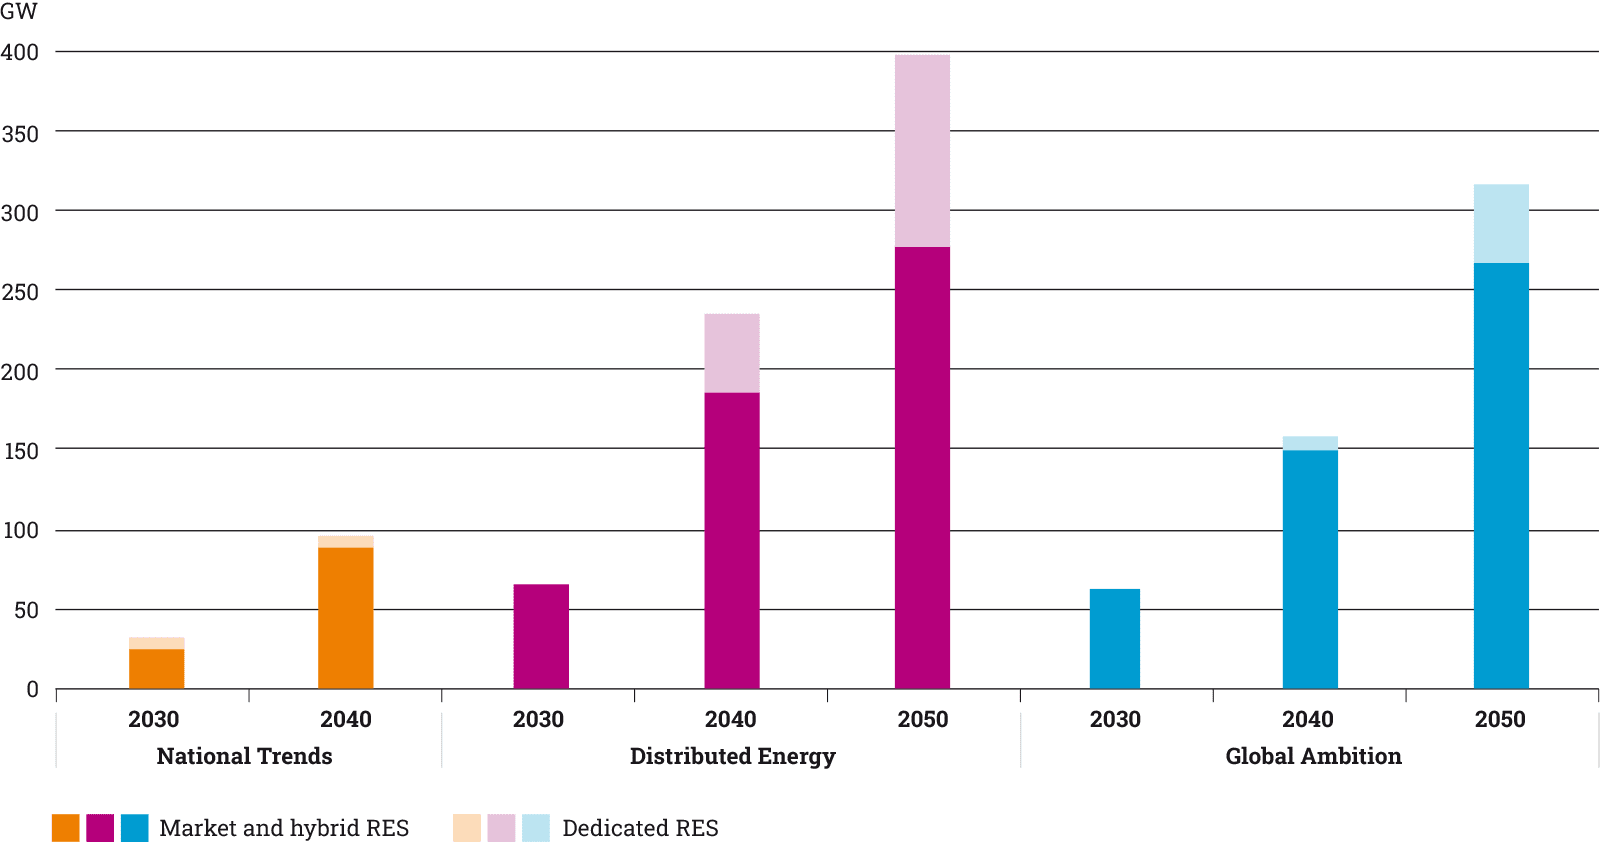
Figure 33: Electrolyser capacity for EU27 (The configurations are explained in the scenario methodology guidelines)
A strong development of electrolysis.
Electrolysers enable the production of hydrogen and other synthetic fuels (synthetic methane and synthetic liquids). It supports the phase-out of fossil fuels and contributes to European energy autonomy, a driver of the Distributed Energy storyline. This scenario also foresees stronger local initiative including off-grid electrolysers (30 % of the capacity), where production directly depends on wind or solar availability. Both drivers trigger a higher electrolyser capacity reaching close to 400 GW in 2050.
As a result from the decarbonisation of the generation mix and the high number of hours at low marginal price, the wholesale electricity market is the main source of electrolysers. In 2050, it accounts for 75 % of electrolyser electricity supply in Distributed Energy and 81 % in Global Ambition14. Electrolyser development also takes advantage of local availability of RES closed to consumption areas, where they can either simultaneously connect to nearby RES and the wholesale market (hybrid RES) or provide a direct connection to the hydrogen grid without expansion of the electricity grid (Dedicated RES).
14 Consideration about a specific market design or requirement laid out in the legal framework (e. g., the criteria’s outlined in the Renewable Energy Directive (RED II) are beyond this edition of the TYNDP scenario report.
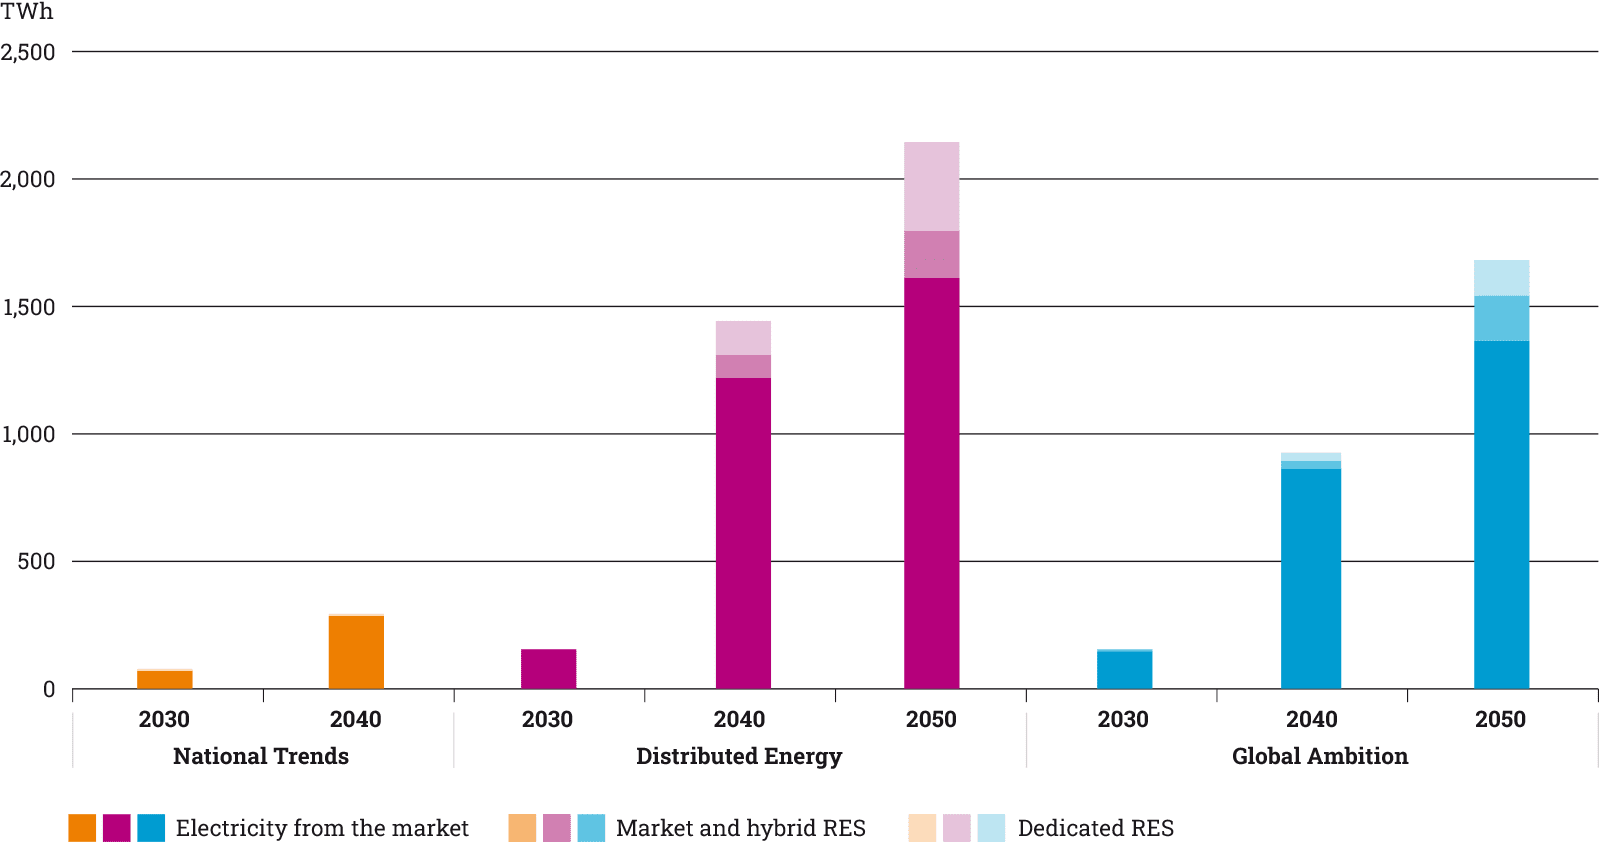
Figure 34: Origin of the electrolyser supply for EU27 (Hybrid renewables are connected to both the electricity grid as well as to an electrolyser)
All unabated production of hydrogen is decommissioned by 2030.
These scenarios have in common that until 2030, all SMR/ATR without carbon capture and storage will be either decommissioned, retrofitted with CCS or replaced by SMR/ATR with CSS. In Distributed Energy low carbon hydrogen plays an important role in the early stage of the transition when supply must be secured while renewable capacities develop. In the longer term SMR/ATR will be decreased.
In Global Ambition the supply of low carbon hydrogen remains important for decarbonising energy supply in the long term, SMR/ATR capacity remaining constant over time.