
Benchmarking
While developing the TYNDP 2022 scenarios, ENTSOG and ENTSO-E make use and benchmark against relevant external studies as captured in the technologies ranges of the Final Storyline report published in April 2021. The purpose of the exercise is to understand whether or not the input assumptions and methodologies that ENTSOG and ENTSO-E employ result in credible and plausible outcomes compared to other expert opinions and methods.
As part of their internal quality process for scenario building, ENTSOG and ENTSO-E have compared the TYNDP 2022 Scenarios to the European Commission’s Impact Assessment Scenarios “Stepping up Europe’s 2030 climate ambition” published in September 20201.
Such comparison is key to ensure that the selection of Project of Common Interest is built upon scenarios consistent with European Commission policy scenarios.
Furthermore, the TYNDP 2022 scenarios are compared with the previous TYNDP 2020. This chapter provides comparisons for a variety of topics and parameters. All comparisons consider EU-27 results by sector and energy vector for 2050.
TYNDP 2022 and EC Impact Assessment scenarios refer to EU27 and take into account the shipping sector and ambient heat. Draft COP21 scenarios have been included in the benchmark to provide transparency on the scenario evolution following the public consultation2.
1 Comparisons are made with REG and CPRICE, which are the scenarios with the lowest and highest energy demand respectively.
2 The comparisons with the TYNDP 2020 edition, which was provided in the draft scenario report, is still available in the Excel found in the download section.
7.1 Final energy demand
2050 final energy demand (excluding non-energy use) from TYNDP 2022 COP21 scenarios is compared with the TYNDP 2022 draft scenarios and the EC Impact Assessment CPRICE and REG scenarios.
For the benchmark with the EC Impact Assessment scenarios the COP21 TYNDP 2022 scenarios include international transport and ambient heat demand. Whereas Agriculture and Other demand is included in Residential & Tertiary category.
Global Ambition and Distributed Energy show a strong alignment in Final energy demand with EC Impact Assessment in 2050. Differences between Global Ambition and CPRICE and between Distributed Energy and REG scenarios is around 3 %3.
3 Around 4 % for the Draft COP21 scenarios
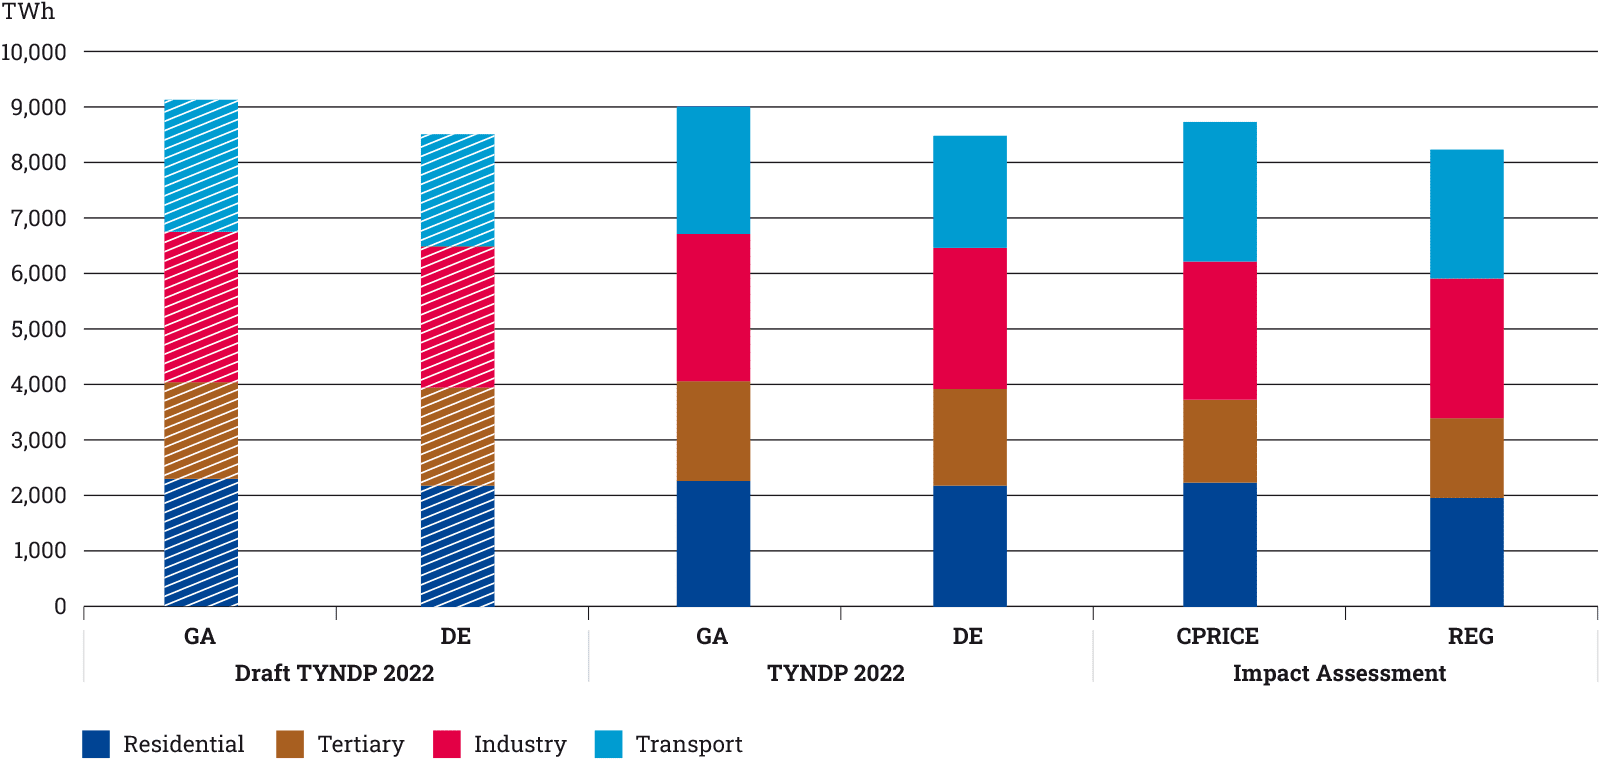
Figure 51: Final energy demand benchmark for EU27
7.2 Final electricity demand
Final electricity demand from TYNDP 2022 COP21 scenarios is compared with the TYNDP 2022 draft scenarios and with the EC Impact Assessment CPRICE and REG scenarios.
The Global Ambition scenario is aligned with the Commission’s CPRICE scenario, showing both a direct electrification4 rate around 42 %. Distributed Energy scenario is a bit more ambitious than the Commission’s REG scenario (52 %5 vs 46 % share).
4 As the ratio between final electricity demand and final energy demand for energy use including aviation and shipping but excluding ambient heat from the heat pumps. Ambient heat has been excluded in order to ease comparison with other studies.
5 Around 49 % in Draft Distributed Energy

Figure 52: Benchmark electricity demand in 2050 for EU27
Distributed Energy scenario has a higher electricity consumption than the Commission’s scenarios (16 % higher than REG) and Global Ambition scenario remains closer to the Commission’s CPRICE scenario (lower than 8 % difference).
7.3 Electricity generation
In 2050, the COP21 scenarios consider a strong increase of both final electricity demand and electrolysis. By that time horizon, there will be no more fossil-based power generation.
It means a redesign of the power generation mix with scenario dependent options being among wind and solar technologies or nuclear.
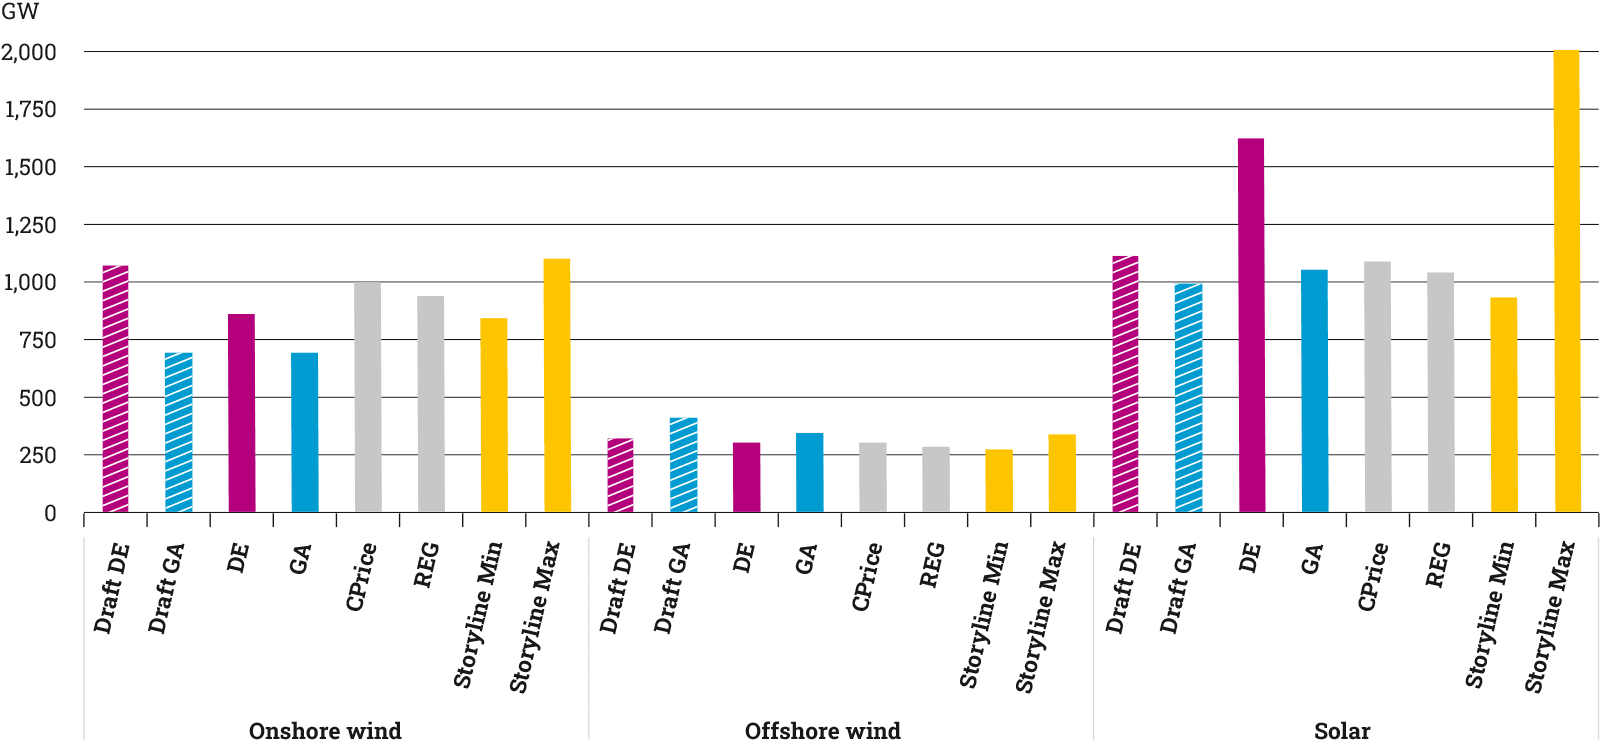
Figure 53: Benchmark of RES technologies in 2050 for EU27
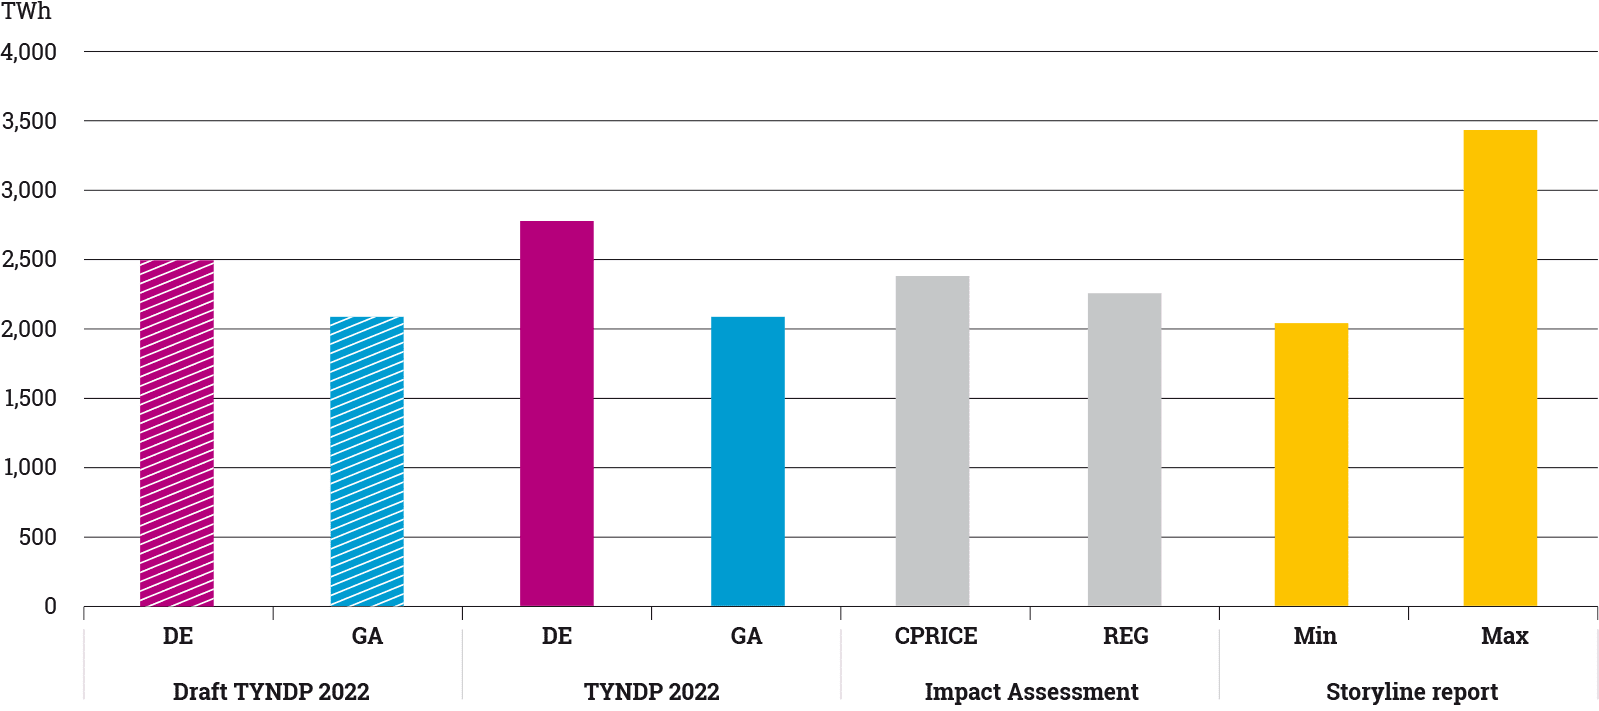
Figure 54: Benchmark of the overall level of wind and Solar PV capacity in 2050 for EU27
In line with its storyline, Distributed Energy strongly focuses on solar which capacity exceeds by 59 % REG scenario level. It is close to the EC scenario for offshore and onshore wind (+6 % and –8 %). The overall wind and solar capacity is 24 % above REG scenario level as the COP21 scenario does not foresee the building of new nuclear reactors which is a distinction from the EC scenario.
In line with its storyline, Global Ambition focuses on offshore wind which capacity exceeds by 14 % CPRICE scenario level. It is close to EC scenario for solar (–3 %) but significantly lower for onshore wind (–30 %). The overall wind and solar capacity is 12 % below CPRICE scenario level as the COP21 scenario requires lower power generation. Such a situation derives from the import of hydrogen and synthetic fuels lowering the need of European based electrolysis compared to CPRICE scenario.
7.4 Gas supply
7.4.1 Methane supply
A more limited and more decarbonised methane supply.
In 2050, the COP 21 scenarios consider an increasing hydrogen demand and as methane decarbonisation is not the main source of hydrogen production, both Distributed Energy and Global Ambition show a reduction in the overall methane supply. The TYNDP 2022 scenarios are substantially lower in methane supply than the EC Impact Assessment, in particular due to the lower natural gas imports and synthetic methane.
In Distributed Energy natural gas is almost completely phased out by 2050 and Global Ambition considers about 300 TWh of natural gas supply, which is primarily imported.
The quantities of renewable methane in TYNDP 2022 scenarios are a bit higher than the EC Impact Assessment scenarios.
The methane demand in the updated Distributed Energy is a bit higher than in the draft scenarios. This is caused by a slightly higher methane demand, in particular for power generation. In Global Ambition the total production of methane as similar as in the draft, however the share of natural gas is reduced.

Figure 55: Methane supply benchmark for EU27
7.4.2 Hydrogen supply
Hydrogen supply transformation: from carbon emitting feedstock to fully decarbonised energy carrier.
By 2050, both COP 21 scenarios consider exclusively renewable or decarbonised hydrogen supply. Methane conversion into low carbon hydrogen through SMR/ATR combined with CCS has a minor role in Global Ambition and has fully disappeared in Distributed Energy. It leaves the possibility to use decarbonisation technologies with renewable methane to produce carbon negative hydrogen.
Global Ambition considers hydrogen supply levels comparable to the EC Impact Assessment and Distributed Energy rather lower levels as a consequence of higher electrification and reduced final energy demand due to higher energy efficiency assumptions. However, both scenarios consider a need for imports to complement the EU production to satisfy the demand. As a result the hydrogen supply mix differs from the EC scenarios.
Both Distributed Energy and Global Ambition foresee lower electrolysis production than the Impact Assessment. Also, the application of the produced green hydrogen is different. The TYNDP 2022 scenarios foresee a lower amount of electrolysis production for e-gas and e-liquids than in the Impact Assessment. Instead, the TYNDP 2022 scenarios focus more on electrolysis for meeting direct hydrogen demand, which is more efficient as it avoids additional conversion losses.
Compared to the draft scenarios for TYNDP 2022, the updated version includes more electrolysis for synthetic methane and liquids production, as requested by stakeholders in the public consultation.
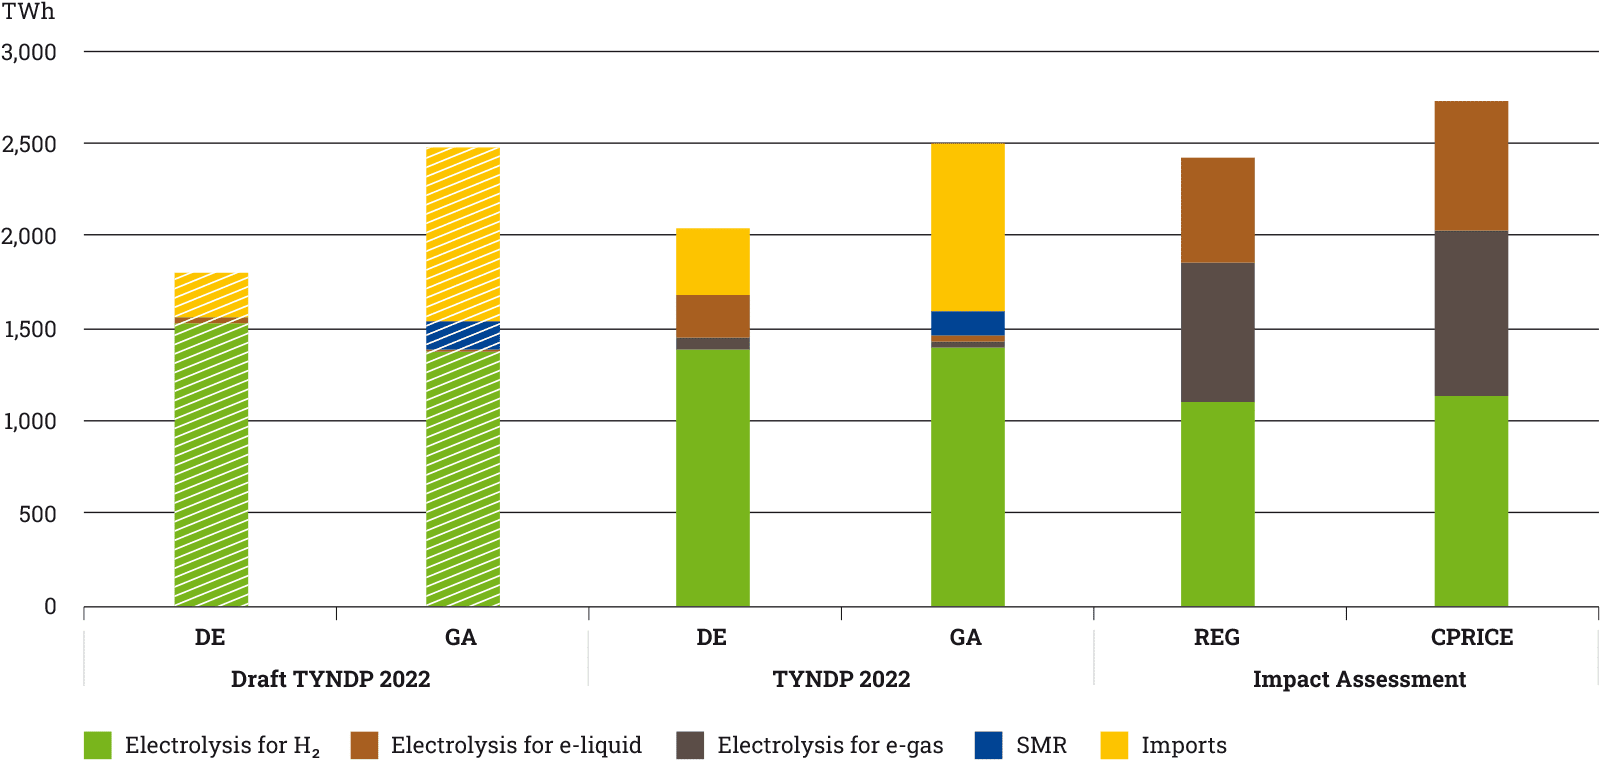
Figure 56: Hydrogen supply benchmark for EU27
7.5 Biomass supply
As discussed in chapter 5.2.2, the TYNDP 2022 scenarios foresee the use of biomass for several applications, e. g. in power generation or in biomethane production. In order to ensure that the scenarios do not overestimate the biomass potential available to these applications, ENTSOG and ENTSO-E benchmark the biomass supply against other studies.
Figure 57 provides a comparison of the TYNDP 2022 biomass supply assumptions against the draft TYNDP scenarios and the EC Impact Assessment. Compared to the draft scenarios for TYNDP 2022, the biomass supply was reduced following stakeholder feedback, in particular in Distributed Energy. Both TYNPD 2022 scenarios are now below the level observed in the EC Impact Assessment scenarios.
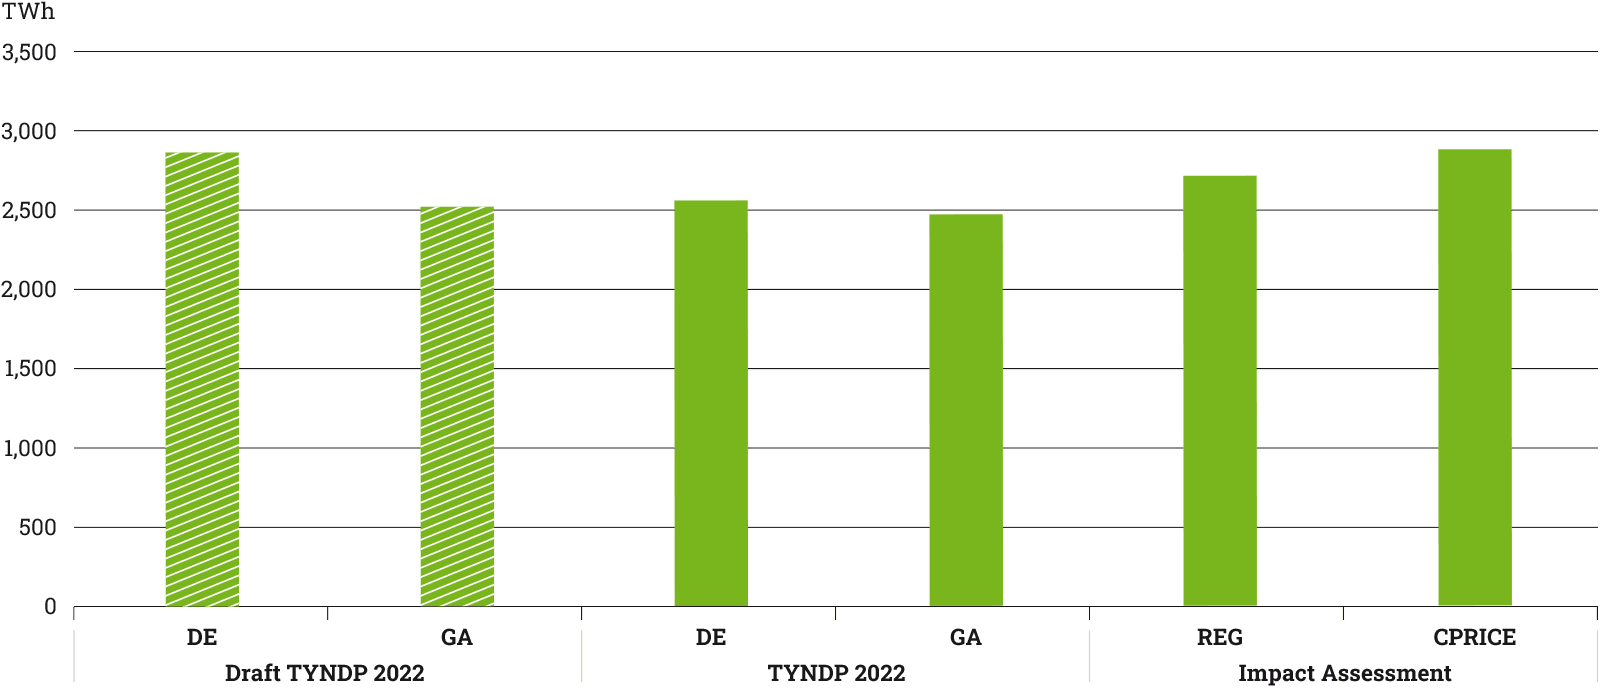
Figure 57: Biomass supply benchmark for EU27
7.6 Energy imports
Figure 58 compares the TYNDP 2022 assumptions on energy imports in 2050 with draft scenarios and the EC Impact Assessment.

Figure 58: Energy imports benchmark (excluding nuclear fuels) for EU27
As Distributed Energy focuses on higher European energy autonomy, this scenario foresees the lowest levels of energy import. By 2050 the total energy imports are reduced to slightly more than 1,200 TWh. This is well below the energy imports in the EC Impact Assessment scenarios. Total energy import in Global Ambition is with about 2,500 TWh quite comparable with the EC Impact Assessment. However, the type of imported energy carrier differs.
Compared to the EC scenarios, Global Ambition foresees less import of oil and more import of (renewable) gas including hydrogen. The higher gas import however stems explicitly from the scenario storyline of this scenario.
Compared to the draft report, the updated scenarios show small changes in energy imports. This is caused by slight adjustments in demand and EU supply assumptions.
7.7 Carbon capture and storage
The EC Impact Assessment does not provide any figures for CCS. That is why the TYNDP 2022 scenario assumptions were benchmarked against some other studies. Figure 59 provides an overview. The following studies were used:
- European Commission (2018), Long Term Strategy
- IEA (2020), Net Zero by 2050
- Hydrogen for EU (2020), Charting pathways to enable net zero
Distributed Energy assumes up to 64 Mt of CCS in 2050. This level is comparable to the lower scenarios in the Long term strategy of the European Commission. Global Ambition assumes up to 662 Mt of carbon capture and storage, in line with IEA study. This is more in the Long-Term Strategy from a few years ago. It is however still well below the CCS levels reached in the Hydrogen for EU study that was released more recently.
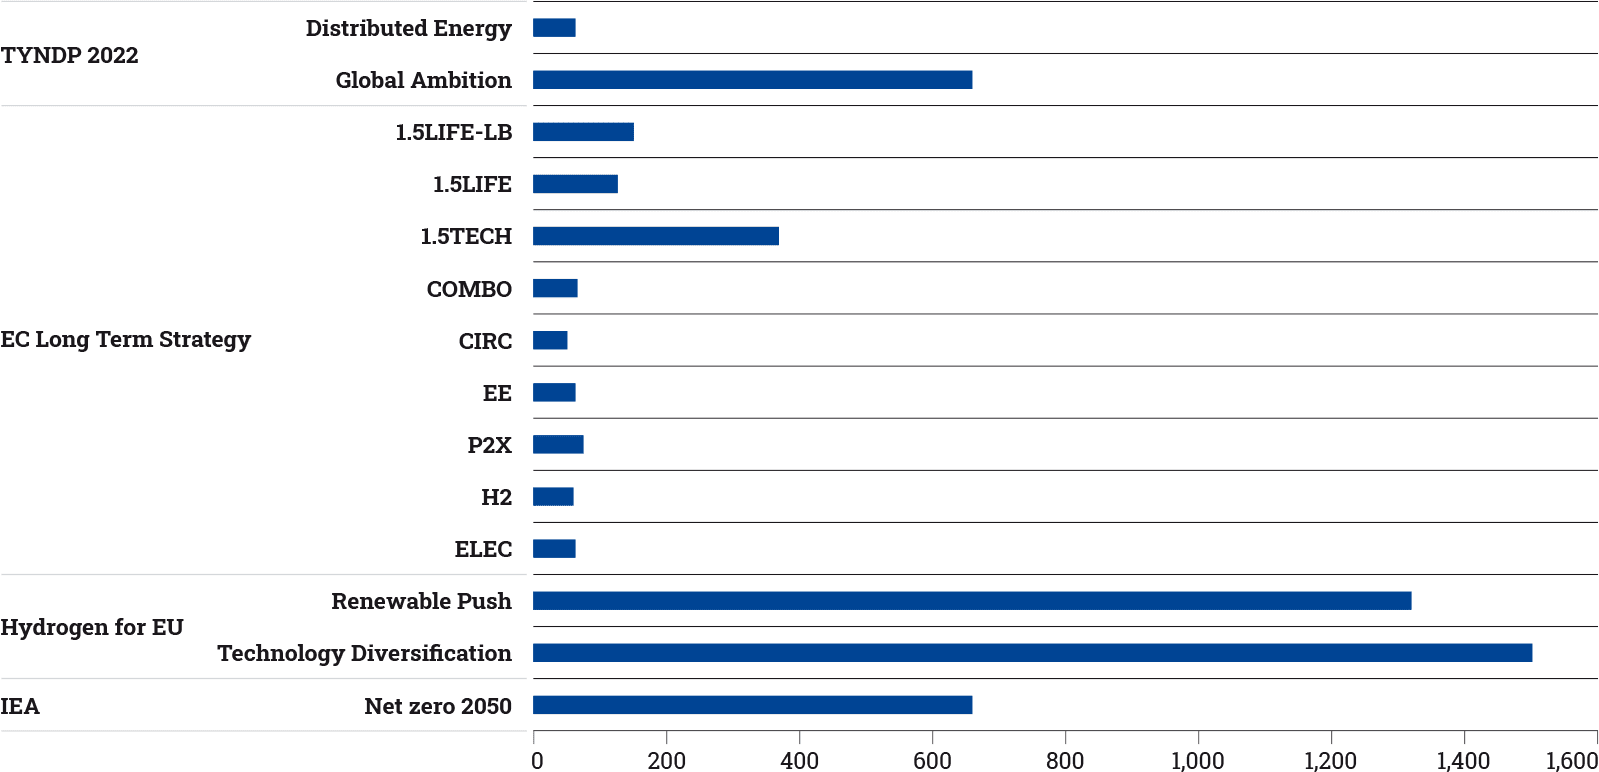
Figure 59: CCS in 2050